
SUMMARY
ICON (ICX/BTC) is putting the finishing touches of what appears to be an Expanded Flat correction which is when the b wave rises higher than the origin point of wave a and c still declines below a. The below chart shows how this expanded flat has the a,b waves each with very three wavish abc (blue) subwaves. Newbies often would try and label the red b wave as the 5th of an impulse. Given how popular the expanded flat is for cryptos, learning how to recognize these would be helpful to any analyst.
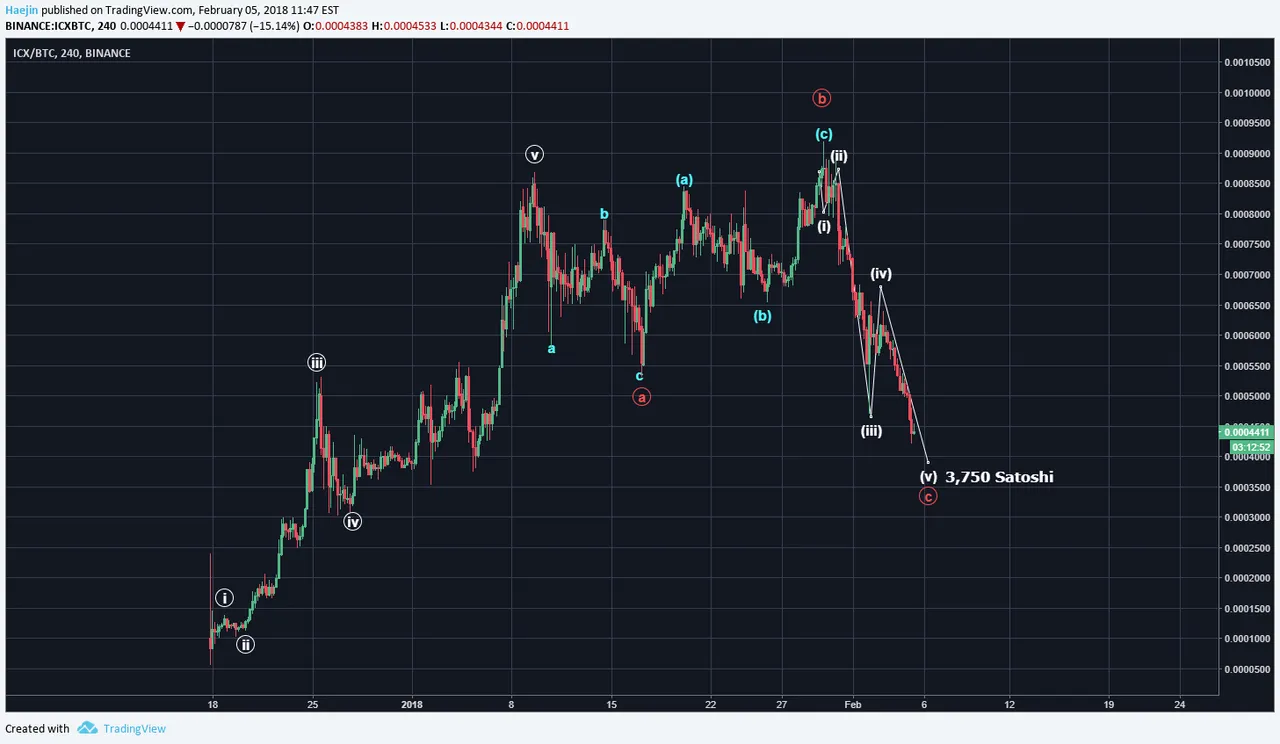
A closer look at 60 minute time frame shows the subwaves of wave C which always has five. The white wave (v) is further subdivided by the blue waves. Using this delineation, a bottom or at least a bounce point could be projected to be near 3,750 Satoshi or so.

Legal Disclaimer: This is only my opinion, make of it what you wish. What does this mean? It means it's not advice nor recommendation to either buy or sell anything! It's only meant for use as informative or entertainment purposes.
Please consider reviewing these Tutorials on:
Elliott Wave Counting Tutorial #1
Elliott Wave Counting Tutorial #2
Elliott Wave Counting Tutorial #3
Laddering and Buy/Sell Setups.
Laddering Example with EOS
Tutorial on the use of Fibonacci & Elliott Waves
@haejin's Trading Nuggets
Essay: Is Technical Analysis a Quantum Event?
Follow me on Twitter for Real Time Alerts!!
Follow me on StockTwits for UpDates!!
--
--

If this blog post has entertained or helped you to profit, please follow, upvote, resteem and/or consider buying me a beer:
BTC Wallet - 1HMFpq4tC7a2acpjD45hCT4WqPNHXcqpof
ETH Wallet - 0x1Ab87962dD59BBfFe33819772C950F0B38554030
LTC Wallet - LecCNCzkt4vjVq2i3bgYiebmr9GbYo6FQf
