
SUMMARY
RIPPLE (XR) has great price destinations and I'd like to share that projected price pathway with you using my Elliott Waves & Chart Pattern Recognition Algorithm.
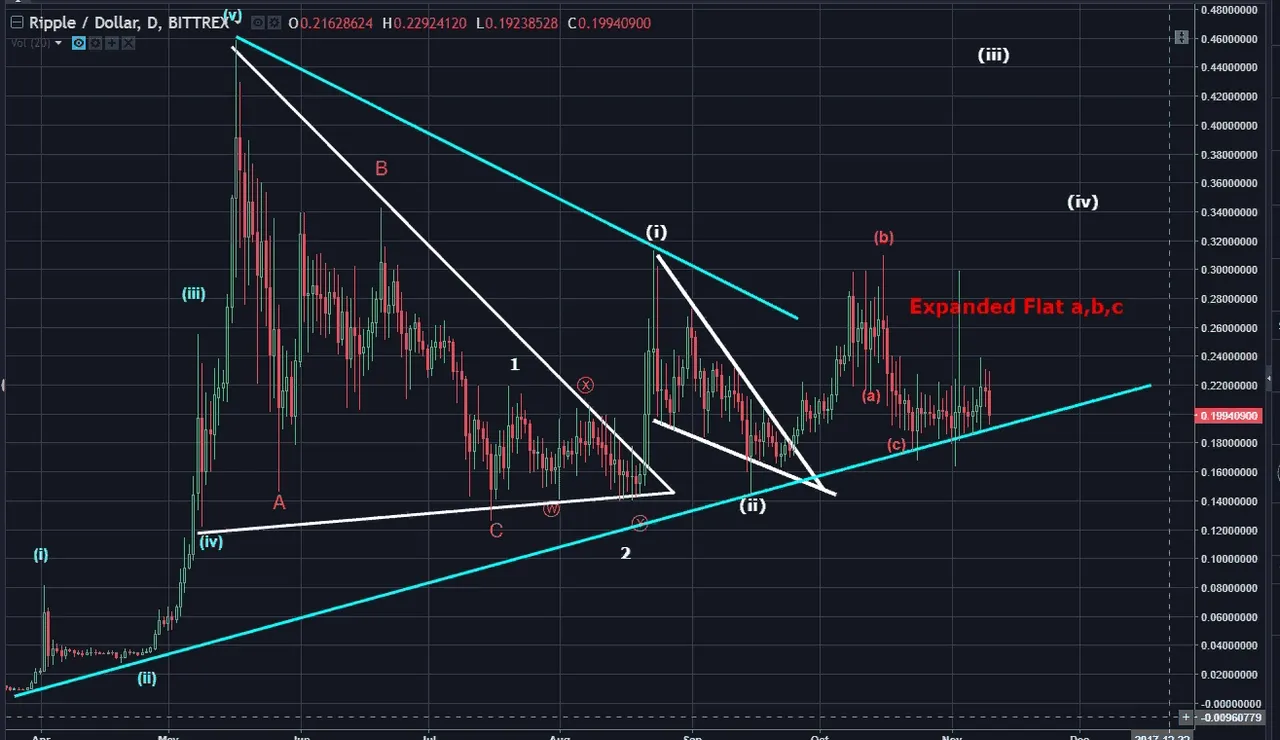
The below chart is a mess of prior labels of waves and patterns. Ignore this chart. Not it was incorrect but too busy with labels. The video analysis takes you through why a clean chart, free of prior markings are ideal for a Technical Analyst.
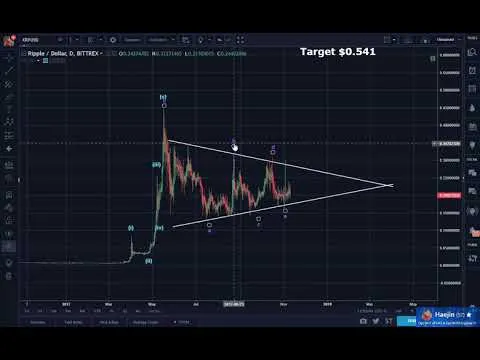
The below chart has redrawn the Chart Pattern such that it is an a,b,c,d,e correction. IF the e wave is complete, then we can expect prices to breach out of the triangle and start impulsing upwards as shown by the blue waves.

The white wave 1,2,3,4,5 is the longer term count and the target is $1.074 or more than 500% profit potential! That is MASSIVE!!
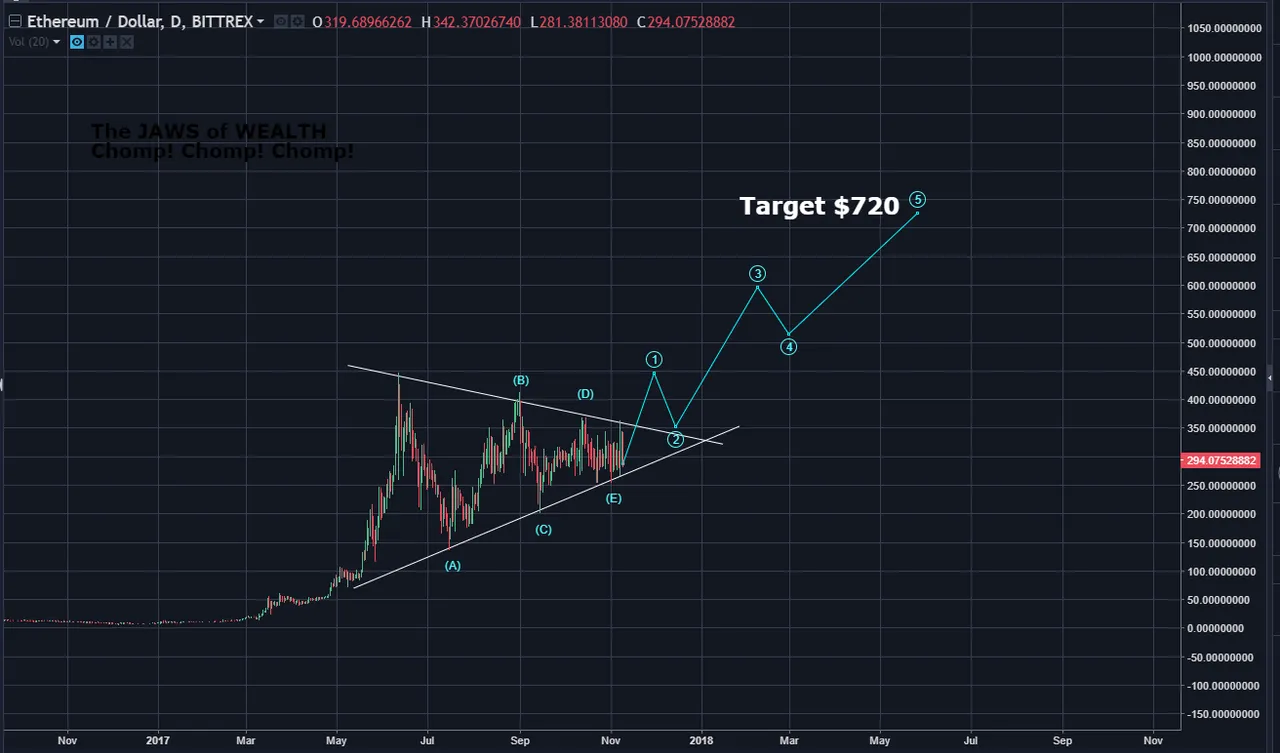
Take a look at the chart of ETH. The simlarity to Ripple is uncanny! These are not accidents! The video has tons more details and the audio is helluva lot better.
Please consider reviewing these Tutorials:
Elliott Wave Counting Tutorial
Laddering and Buy/Sell Setups.
Tutorial on the use of Fibonacci & Elliott Waves
These Technical Analysis Books: Elliott Wave Priniciple & Technical Analysis of Stock Trends are highly recommended
--
--

If this blog post has entertained or helped you to profit, please follow, upvote, resteem and/or consider buying me a beer:
BTS Wallet - d2e60e9856c36f34
BTC Wallet - 15ugC4U4k3qsxEXT5YF7ukz3pjtnw2im8B
ETH Wallet - 0x1Ab87962dD59BBfFe33819772C950F0B38554030
LTC Wallet - LefeWrQXumis3MzrsvxHWzpNBAAFDQbB66

Legal Mumbo Jumbo: This is only my opinion, make of it what you wish. What does this mean? It means it's not advice nor recommendation to either buy or sell anything! It's only meant for use as informative or entertainment purposes.**