SUMMARY
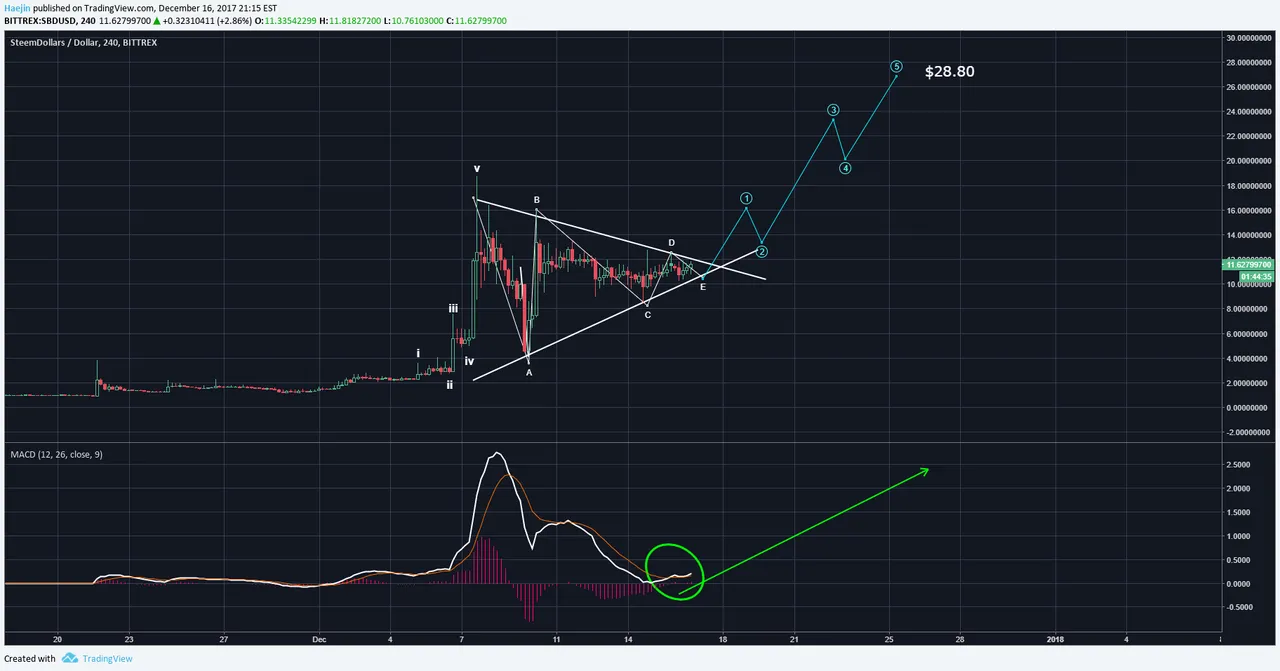
Steem Dollars (SBD) is now about complete the confluence of technical events for the next ROCKET UP!! The below chart shows an uncanny a,b,c,d,e triangle that nearly complete, if not already! The MACD indicator is about to turn up as well (green circle and arrow). The blue lines are targeting $28.80 or MUCH HIGHER!!
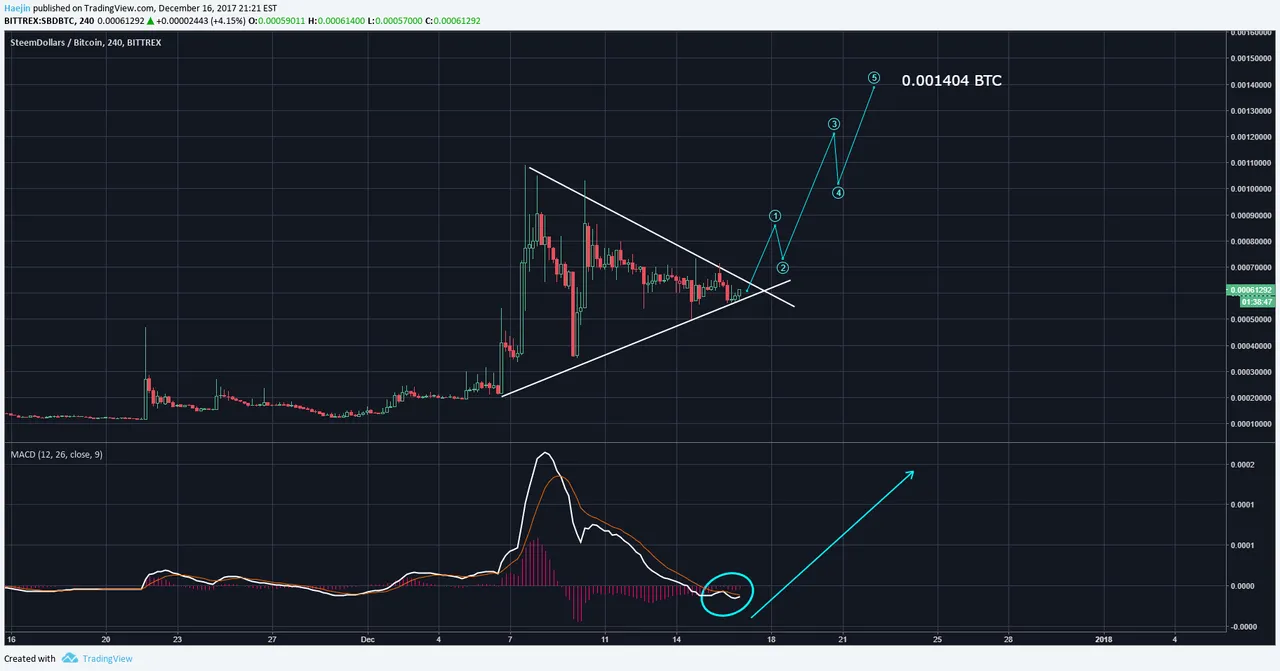
Here is the SBD/BTC pair and frankly, can't tell the difference between this chart and that of the SBD/USD!! They are near identical!! This is bullish! IF BTC is rising, then SBD/BTC should fall at equilibrium demand. However, the demand for SBD/BTC is so high...even if BTC rises, SBD/BTC will rise! This is UBER BULLISH!!
Please consider reviewing these Tutorials on:
Elliott Wave Counting Tutorial #1
Elliott Wave Counting Tutorial #2
Elliott Wave Counting Tutorial #3
Laddering and Buy/Sell Setups.
Laddering Example with EOS
Tutorial on the use of Fibonacci & Elliott Waves
These Technical Analysis Books: Elliott Wave Priniciple & Technical Analysis of Stock Trends are highly recommended
@haejin's Trading Nuggets
Essay: Is Technical Analysis a Quantum Event?
Follow me on Twitter for Real Time Alerts!!
--

If this blog post has entertained or helped you to profit, please follow, upvote, resteem and/or consider buying me a beer:
BTS Wallet - haejin1970
BTC Wallet - 1HMFpq4tC7a2acpjD45hCT4WqPNHXcqpof
ETH Wallet - 0x1Ab87962dD59BBfFe33819772C950F0B38554030
LTC Wallet - LecCNCzkt4vjVq2i3bgYiebmr9GbYo6FQf

Legal Mumbo Jumbo: This is only my opinion, make of it what you wish. What does this mean? It means it's not advice nor recommendation to either buy or sell anything! It's only meant for use as informative or entertainment purposes.**