I'm just expressing my observations from the market, as I have focused to buy back all my account value in to BTC and ETH soon, and wait back to moon :D
So I think loud here (also on my twitter account) to see ohters' feedbacks and comments. I may change your opinion and you may change mine! but non of our talks and discussions mean as advise and prediction, it's just studying the probabilities each of us see.
Crypto vs Stocks time span
I'm looking forward buying BTC for a long term holding. By longterm, I mean more than 6 months and less than a year, which is long term for crypto, I assume. in stock market I call it short to midterm.
So I need to focus on weekly chart rather than daily charts to find trends and trusted bottoms and choose the entry point in Daily chart. this has been my strategy since beginning.
in the weekly chart we have this right now:
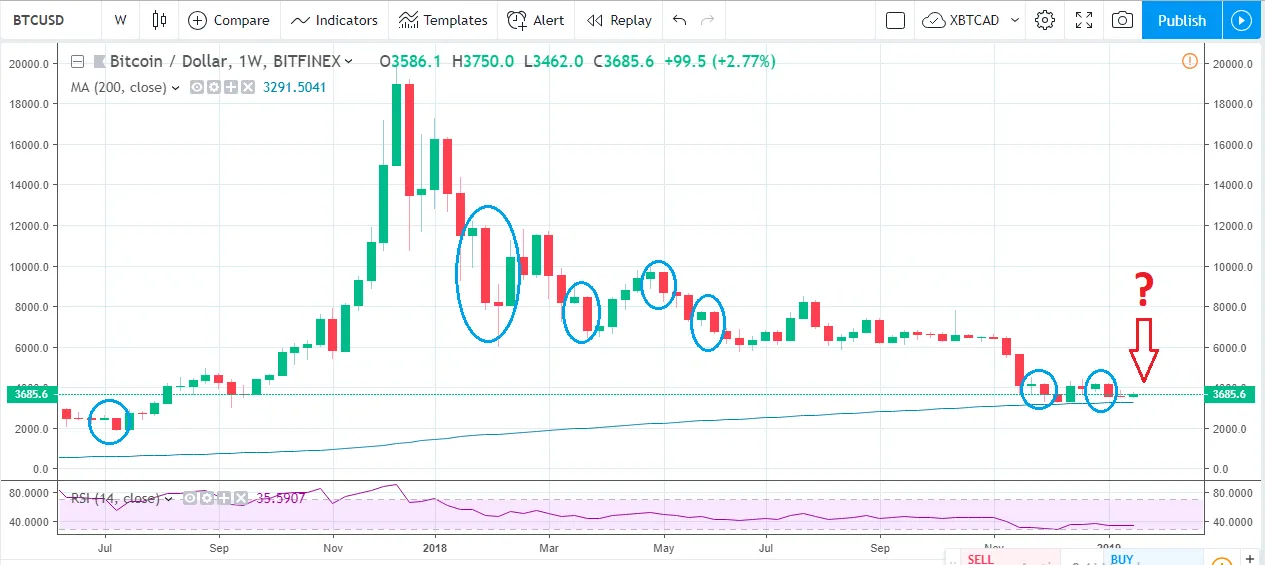
here we have a repeated pattern: every week with a small gain, has continued by a drop from 3 to 7 times bigger than itself. There are very few (one or two) opposite samples, comparing to 7 right samples I have marked in the image.
The 200 Weekly Moving Average
Now combine this with the popular and important 200 WMA in the chart. if the next week starts with a drop, at least 3 times bigger than current week's gain, BTC will test the $3300 level which will be the 200WMA
I can see below probabilities:
- higher probability
BTC tests the level, may even see $3000 psychological support level but will close near the main support, slightly below or higher than 200 WMA - medium probability
It will test the 200 WMA as a support level but bounces back and continues the sideways - lower probability
it will continue rising, in a stronger or same strength