Technical factors say bitcoin may be about to pop.
We have a couple technical indicators setting up that may mean we are about to move up in a significant way.
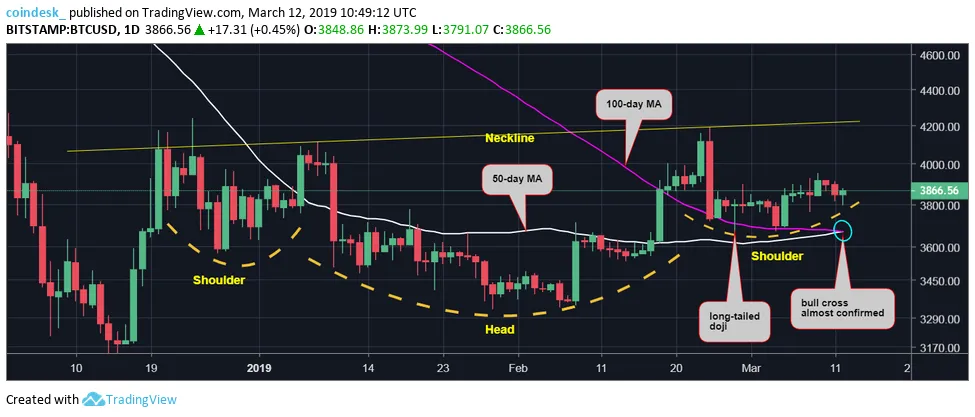
When looking at a daily chart of bitcoin, we can see several bullish patterns starting to emerge.
First, we have a shorter moving average (50 day MA) about to pass through a longer period moving average (100 day MA).
This type of pattern is often called a golden cross and is considered a bullish pattern:

(Source: https://www.coindesk.com/bitcoin-will-soon-see-bull-cross-in-first-since-august-2018)
Secondly, looking at the above chart we can also see a possible inverse head-and-shoulder pattern possibly playing out.
We are on the right shoulder currently of that pattern.
If prices can hold up here, they are likely to break the neckline to the upside, which is up near $4,200.
It's all about perspective...
Those things may indeed look bullish, but not everyone sees them the same way.
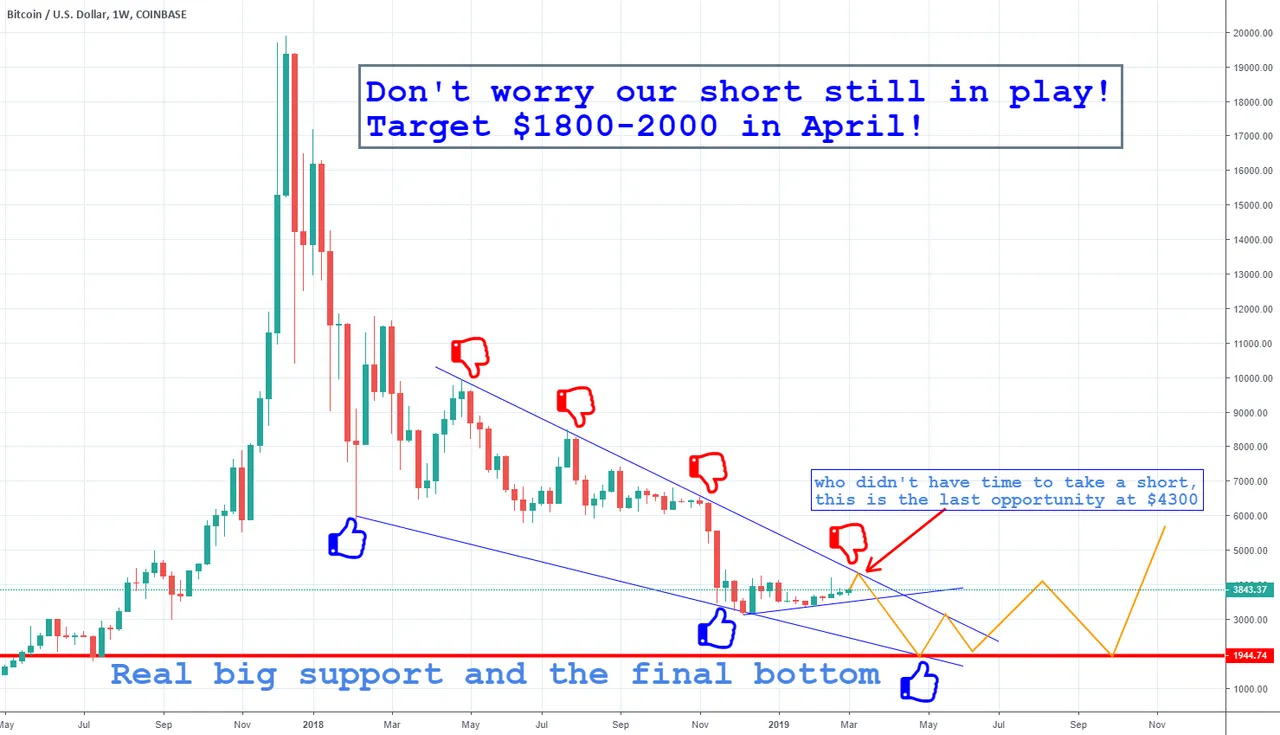
Check out this zoomed out view of the current price action:

(Source: https://www.tradingview.com/chart/BTCUSDSHORTS/mNe3L1MS-IF-YOU-WANNA-BE-RICH-YOU-GOTTA-BE-IN-SHORT/)
They are also saying we may get a short term bounce up near $4,200...
However, they think the play is to short it there because we are going to make one more lower low shortly afterwards.
What do you see?
Stay informed my friends.
-Doc