Bitcoin has been in a massive downtrend pretty much all of 2018.
There have been some relief rallies along the way, but for the most part, prices have continued to make new lows every couple of months.
That is in stark contrast to what many believed first entering the year.
People had been calling for all kinds of "high prices". From $25k all the way up to $100k, and there was no shortage of predictions landing anywhere in between.
Those predictions look pretty silly now as we are more than half way through the year and the price is a long ways away from even the more conservative of those predictions.
However, we may be on the verge of a trend change and a rather large move up.
Check out this chart:
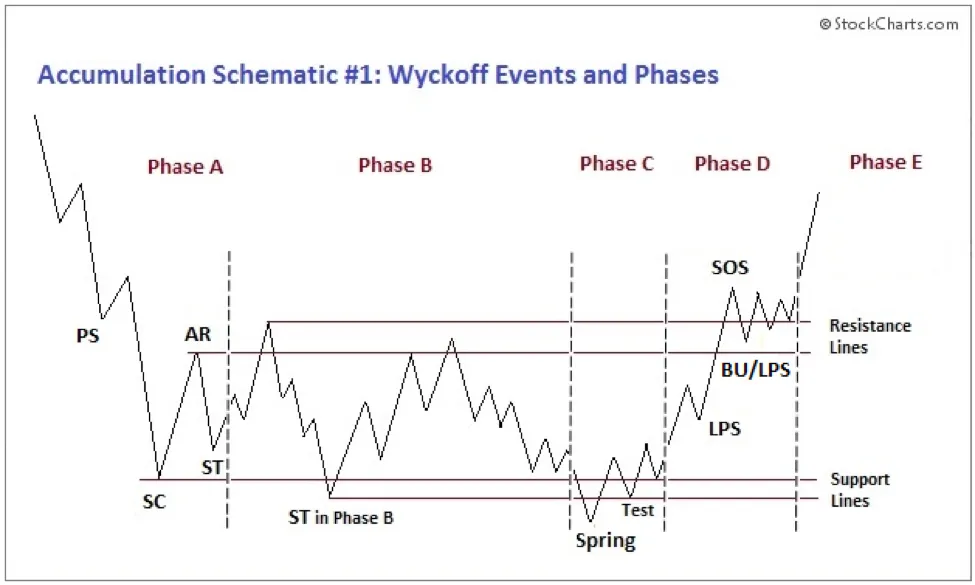
(Source: http://stockcharts.com/school/doku.php?id=chart_school:market_analysis:the_wyckoff_method)
That is a chart of the accumulation phase according to the Richard Wyckoff theory of markets and price action.
According to Richard Wyckoff, there are 4 major phases of market activity and price action:
- Accumulation
- Mark Up
- Distribution
- Mark Down
As you can see, the chart above shows what often happens during the accumulation stage before an asset or security makes a move higher.
Does that price action look at all familiar to anyone else?
Enter Bitcoin:
Let's take a chart of bitcoin and compare how it has been trading over the last 6 months to that of the accumulation chart above...
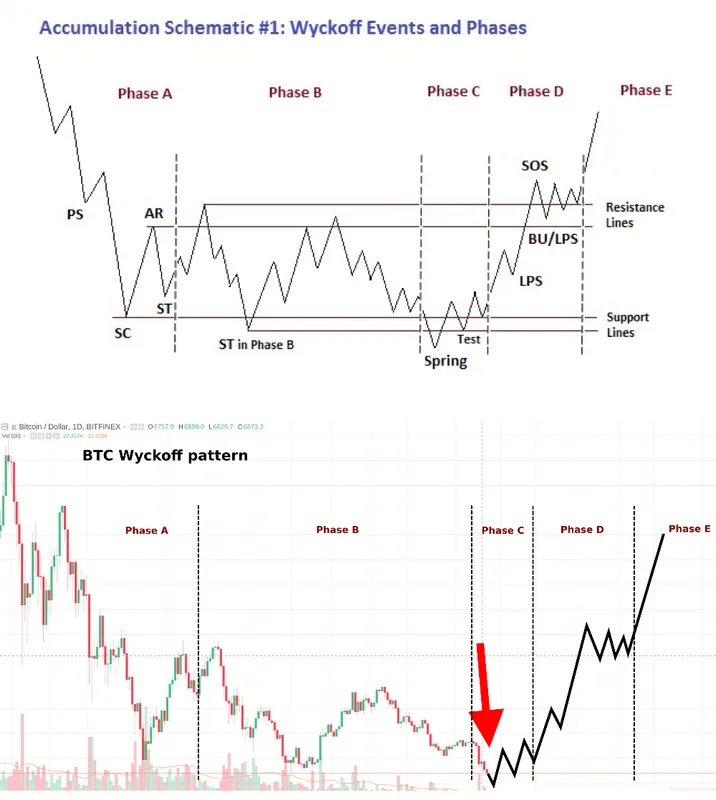
Look at that, it matches up almost identically.
What's more, that red arrow points out to where we are currently on that chart.
If that trend holds up, bitcoin is on the verge of finally breaking out of this accumulation stage and heading much higher.
There is no guarantee that history will repeat or that this chart pattern will hold up, but it is very interesting that bitcoin mirrors almost exactly the kind of pattern that Mr. Wyckoff noted oh so many years ago had a tendency to precede large moves higher.
Here's to hoping history repeats!
Stay informed my friends.
Follow me: @jrcornel