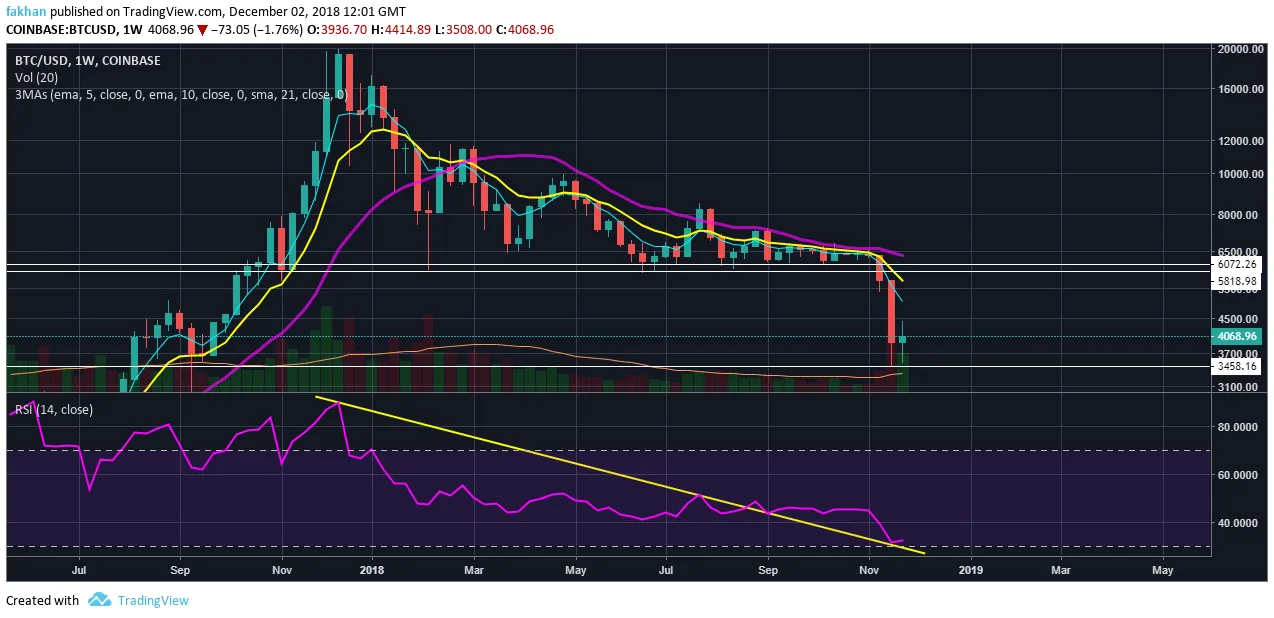
This is a weekly chart of BTC/USD.
We can see the high there of close to $20k, all the way down to our current level of just over $4k.
After a significant drop, we can see a little green on the screen this week...
The RSI is in significantly oversold levels, plus we may have some bullish divergence showing up as there was a downtrend line break...
What does this chart look like to you?
(Source: https://cryptodaily.co.uk/2018/12/bitcoin-significance-of-the-two-production-costs-and-key-levels
I will reserve my thoughts until I hear some thoughts from the community.
Tell me what you see in the comments section below.
Stay informed my friends.
Follow me: @jrcornel