For those of you that don't believe Bitcoin is a store of value, check these charts out:
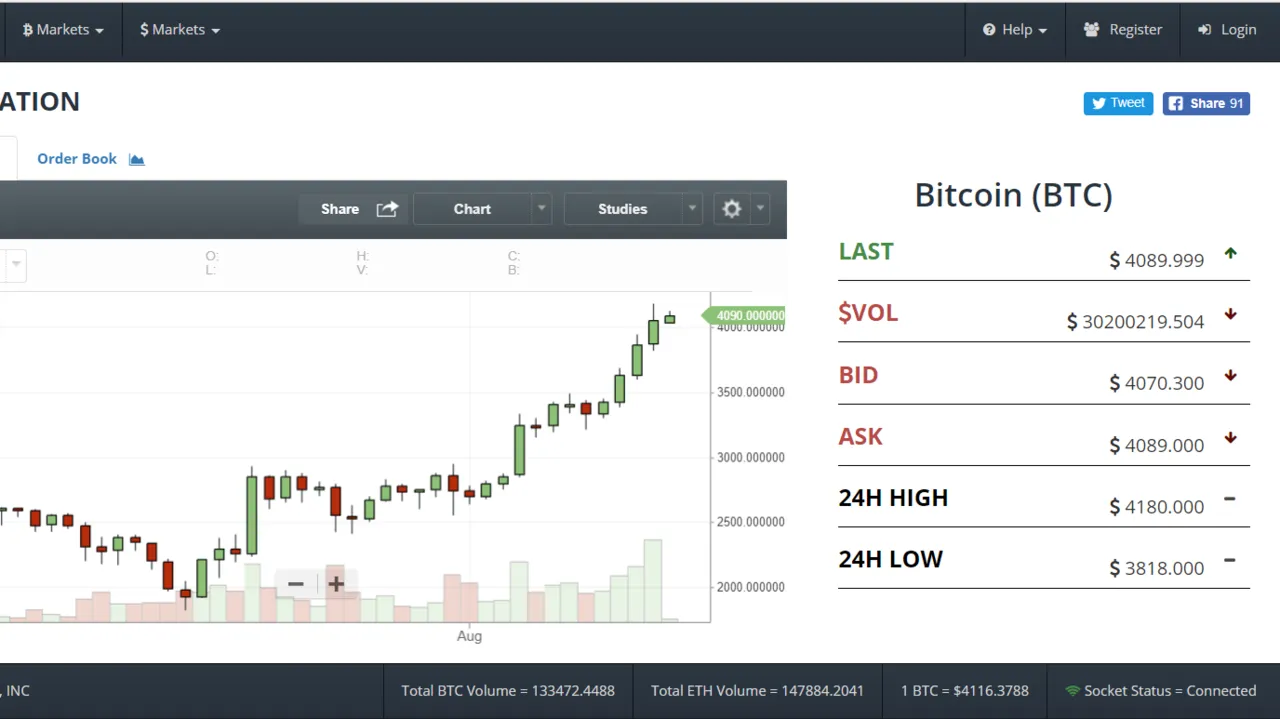
This is a daily chart of Bitcoin over the last couple months. Specifically check out the price action over the last 4 days.
Straight up.
Now contrast that with this chart of the S&P U.S. Stock Index:
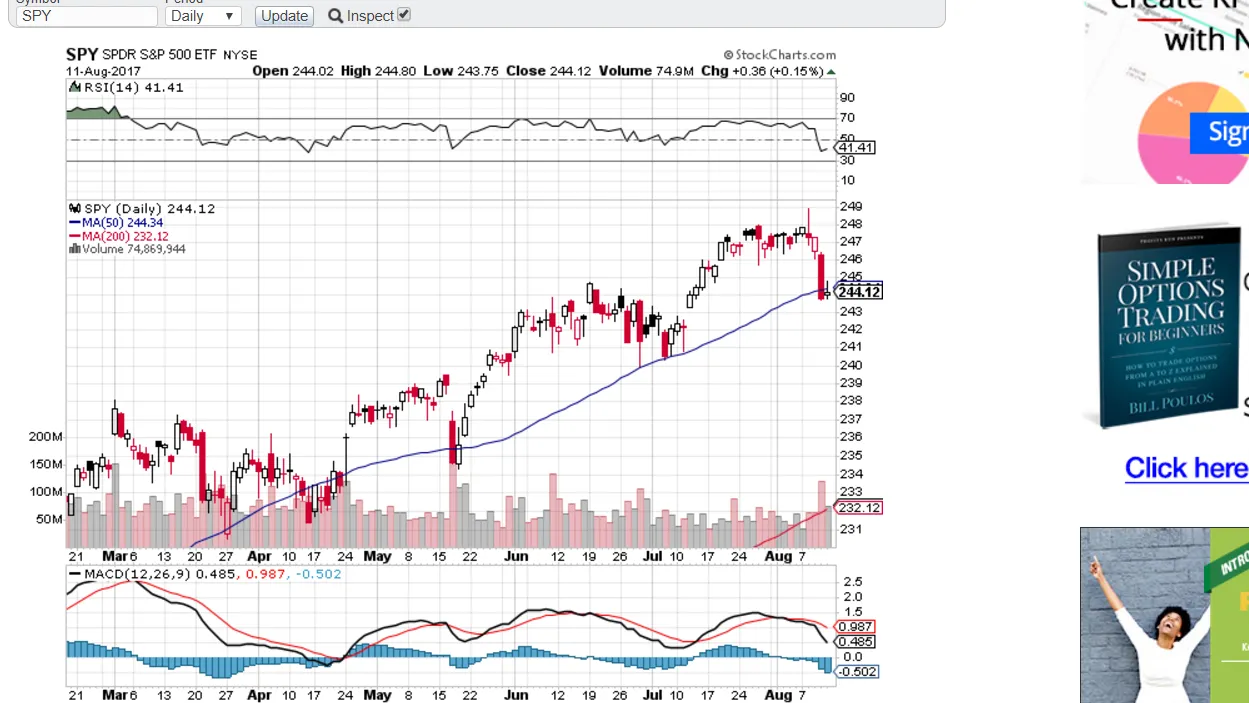
Again this is a daily chart covering the last couple months, but look specifically at the last 4 trading days.
As you can see it has been pretty rough in the stock market over this time, almost straight down.
More to the story...
Obviously there is more to this situation than just geopolitical uncertainty as Bitcoin is coming out of a period of uncertainty regarding Bitcoin Cash and SegWit.
That combined with massive demand has created a moon shoot for BTC.
However, it is interesting to note that Bitcoin seems to be moving inversely to the stock market and more in line with gold.
Specifically because Bitcoin has often been referred to as digital gold because it tends to behave more like an asset than an actual currency.
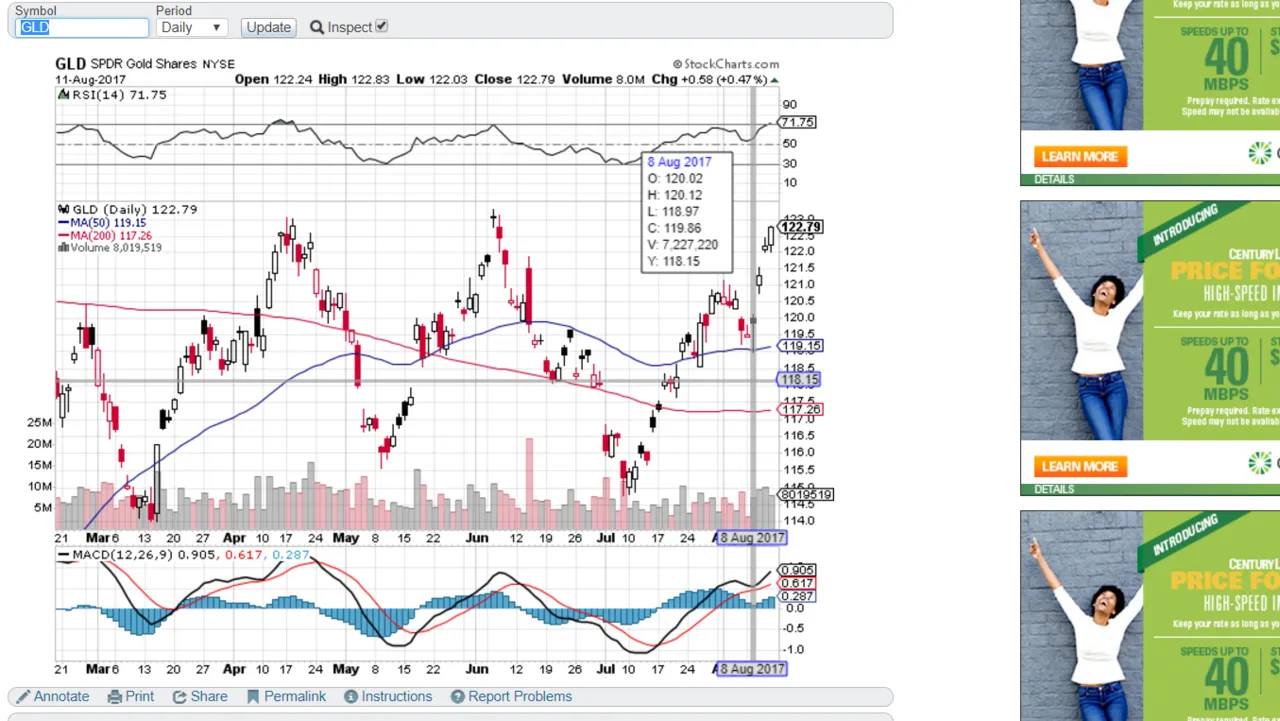
Digital Gold indeed!
It seems as global uncertainty spikes, so does the price of Bitcoin.
Bring on the uncertainty, from a purely Bitcoin price perspective! :)
Stay informed my friends.
Image Sources:
https://bittrex.com/Market/Index?MarketName=USDT-BTC
http://stockcharts.com/h-sc/ui
Follow me: @jrcornel