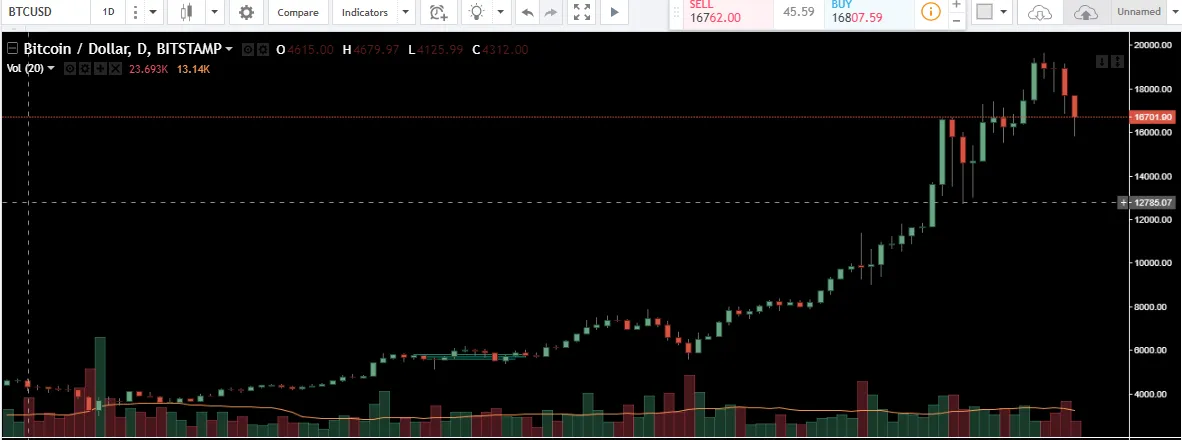
Hey Guys so yeah I am not a professional by any means.I am sharing my views based on whatever I have learnt about TA in the past few months.
So it appears as though bitcoin is finally entering a correction phase so lets try to break it down.

Whenever something major happens in the markets I like to consider these 3 Indicators to get market sentiment
So for starters the Volume for BTC in the last 24 hours was 19 billion which is significant.This helps in understanding that if there is a move in the market it will be significant.Volume is a key indicator i consider for understanding the market.
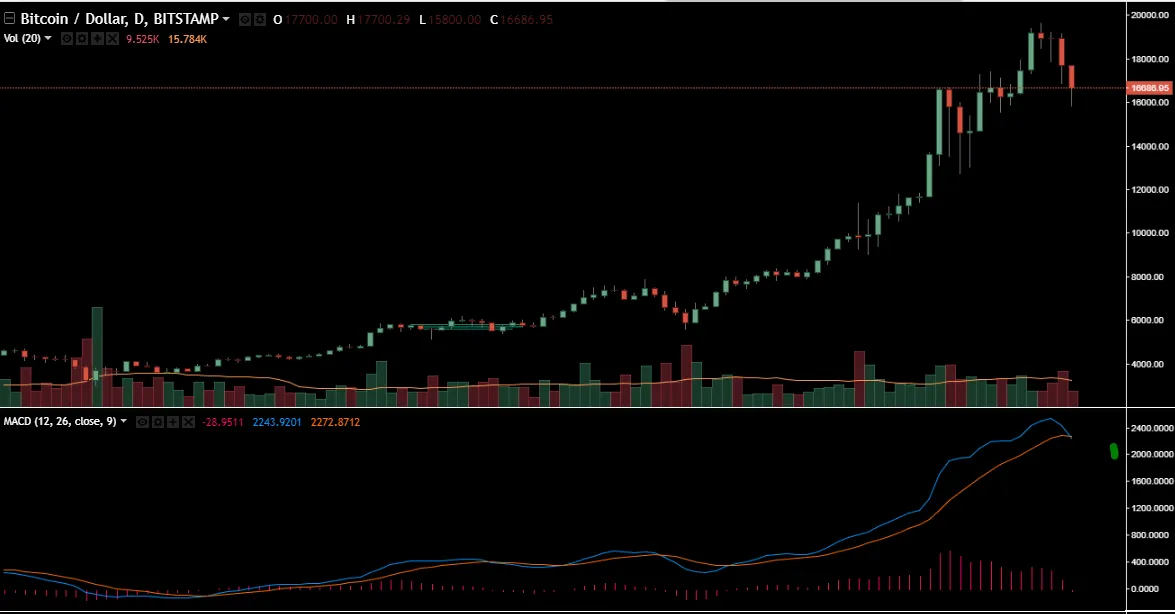
Secondly we consider MACD scale(Green Mark) on the daily chart.

The blue line(12 day exponential moving average) which was above the orange line (26 day exponential moving average) is finally dipping under the orange line .This is generally an indication of a downward trend especially when followed by the volume.
Lastly we consider the Relative Strength Index (Green watermark).

The Relative strength index of Bitcoin was originally over extended(overbought) but now Bitcoin is back in between
30 and 70 on this scale .
In the past we have seen bitcoin bounce from 30 on RSI but i don't expect this correction to be that long.I don't know the most profitable entry points but i will be keeping a close eye on RSI to see where it finds some base and make my trades accordingly.
Feel Free to let me know what you think about my analysis.