The technical analysis of bitcoin looks like this: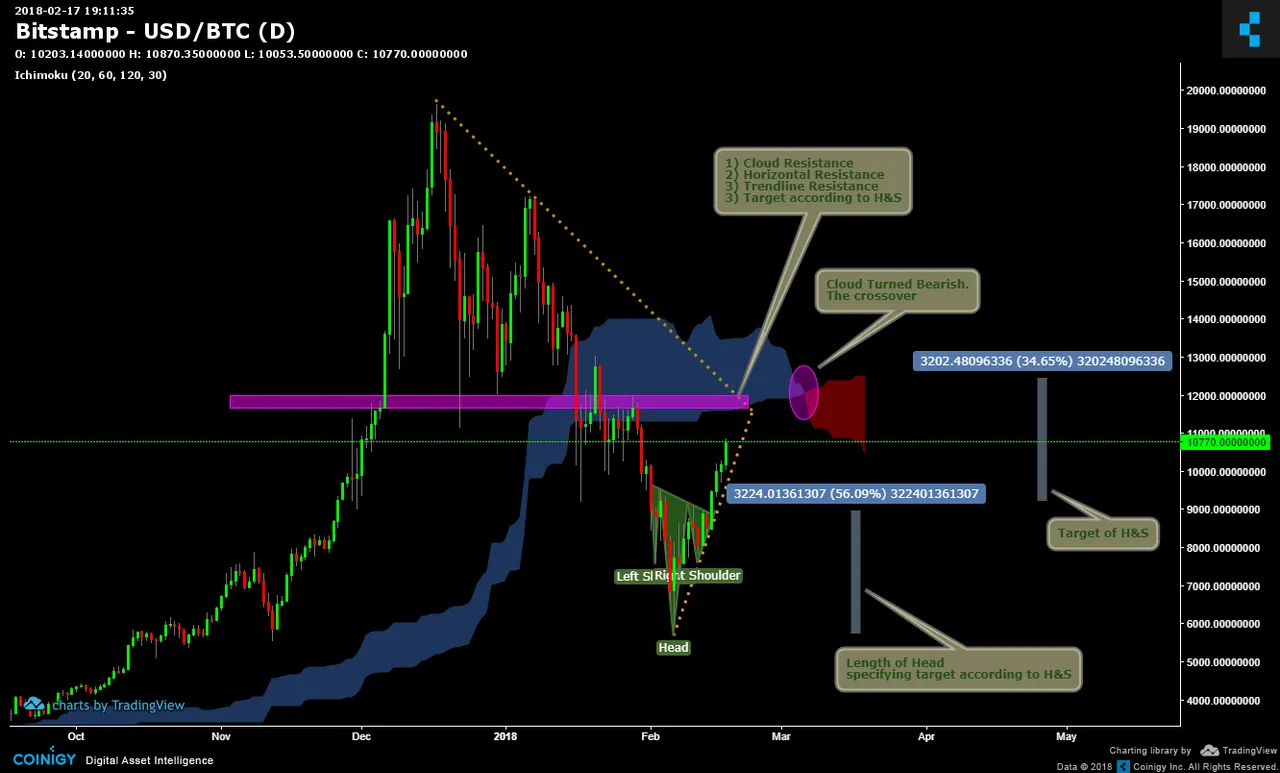
Head and shoulder:
So we formed head and shoulder pattern in 1 day time frame few days back. The head having its low at 5500.
Sharing a little bit info here, Head and shoulder pattern in a down trend indicates bullish reversal and the target is equal to the length of head.
So according to the length of the Head we might go to 11700.
Strong Resistance:
Strong resistance zone is present at 11700 due to the following reasons:
1) Resisting Trendline:
Resisting trendline is offering resistance at this zone. Bitcoin has already tested this line two times and this time it will also test it.
2) Cloud reesistance:
Ichimoku cloud resistance is also present in this zone.
3) Horizontal zone:
Looking at the wicks of candles, horizontal resistance zone is also present here.
4) Head and shoulder Target:
This target also comes in the same zone at 11700.
Bear Run:
We will have bear run till 4200. Still sticking to my statement. Whales are still waiting for entry thats why we have btc dominance of only 36%. THe main reason of this is also the cloud crossover mentioned in the chart. Cloud has turned bearish for the first time after 15 November 2016 in 1 Day timeframe.
Short term Bull run:
I said earlier in this post that we will test 11700. THe main reason of this is that in 4 hour timeframe the cloud has turned green which indicates the bull run for short term. Also a trendline has been broken.