🐒 USERS ONLINE 
🐒 ONLINE USERS AT POLONIEX BITCOIN PRICE correlation I started collecting data on online users at poloniex . I try to collect the data about the same time every day. I was thinking it would be interesting to see how the amount of users increase or decrease with the Bitcoin price .
🐒
BLUE COLUMN = USERS CURRENTLY ONLINE AT POLONIEX AT TIME DATA WAS COLLECTED
RED LINE = BITCOIN PRICE AT THE TIME DATA WAS COLLECTED
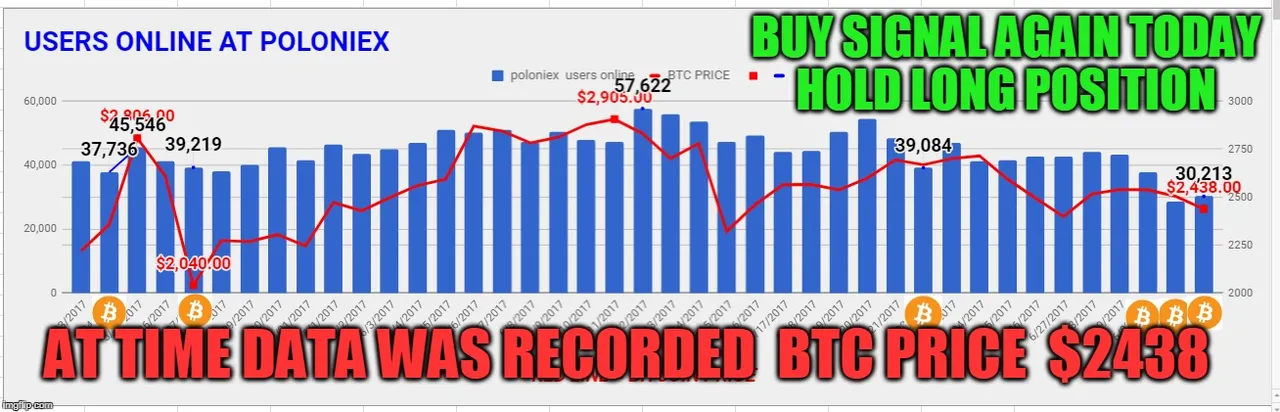
SUMMARY
🐒 I may have isolated a possible chart pattern showing the possibility of Bitcoin rising in price . The pattern works like this when Polinex users ( Blue Column ) fall below 40,000 we can look for a rise in Btc price over the following 24hr . I have placed a Bitcoin symbol at bottom of chart to show when this has occurred. And this has happened now 3 times and so far it has worked 3 for 3 for BTC to rise in price over the next 24 hr's when users fall under 40,000.Below are the results of using this Buy pattern.
BITCOIN BUY PATTERN
| DATE | BUY PRICE | SELL AFTER 24HR | PROFIT / ( LOSS) |
|---|---|---|---|
| 5/24/2017 | $ 2357 | $ 2806 | $ 449 |
| 5,27,2017 | $ 2040 | $ 2273 | $ 233 |
| 6/22/2017 | $ 2668 | $ 2700 | $ 32 |
| 6/30/2017 | $ 2537 | $ |
🐒
DISCLAIMER : This content is for informational, educational and research purposes only.
Please get the advice of a competent financial advisor before investing your money in any financial instrument.
It is strongly recommend that you consult with a licensed financial professional before using any information provided here . Any market data or news commentary used here is for illustrative and informational purposes only.
Please voice your opinions in the comments below..
🐒