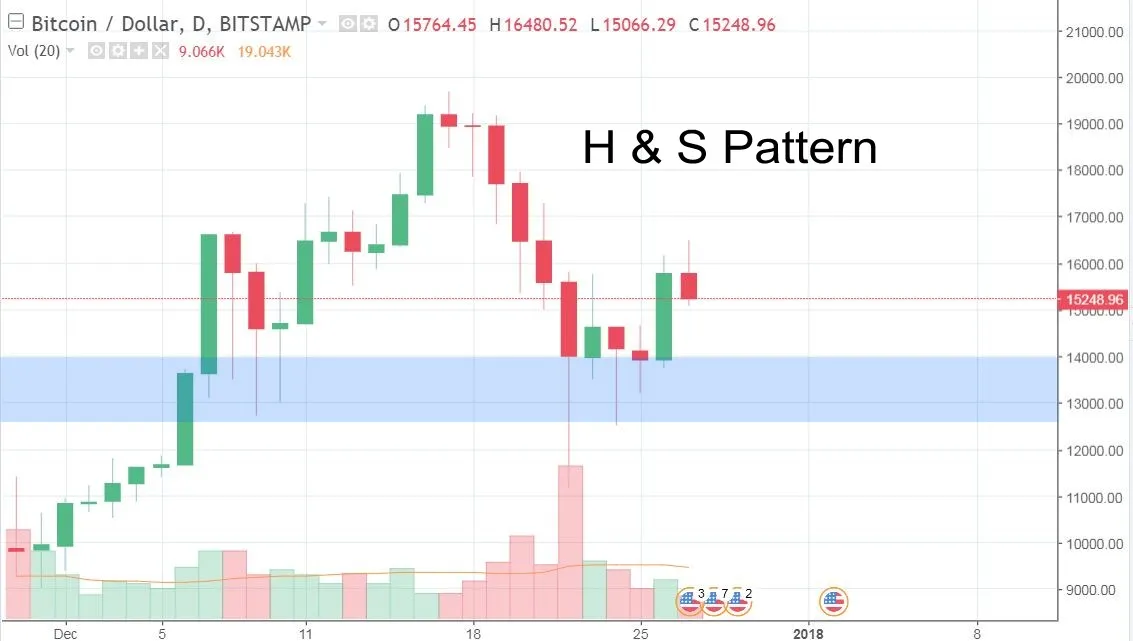
Bitcoin @15300 after testing a high of 16500 today the price is again moving downward,
Above shown is the daily chart of Bitcoin, it is forming possible head and shoulder pattern with support zone at 14000 - 12700 level. Looking at the daily chart this is going to be the next zone where price is going to decide next move.

Up next we have 4 hours chart which is also portraying the same picture. The market seems to be range bound between 13000 and 16500 level.
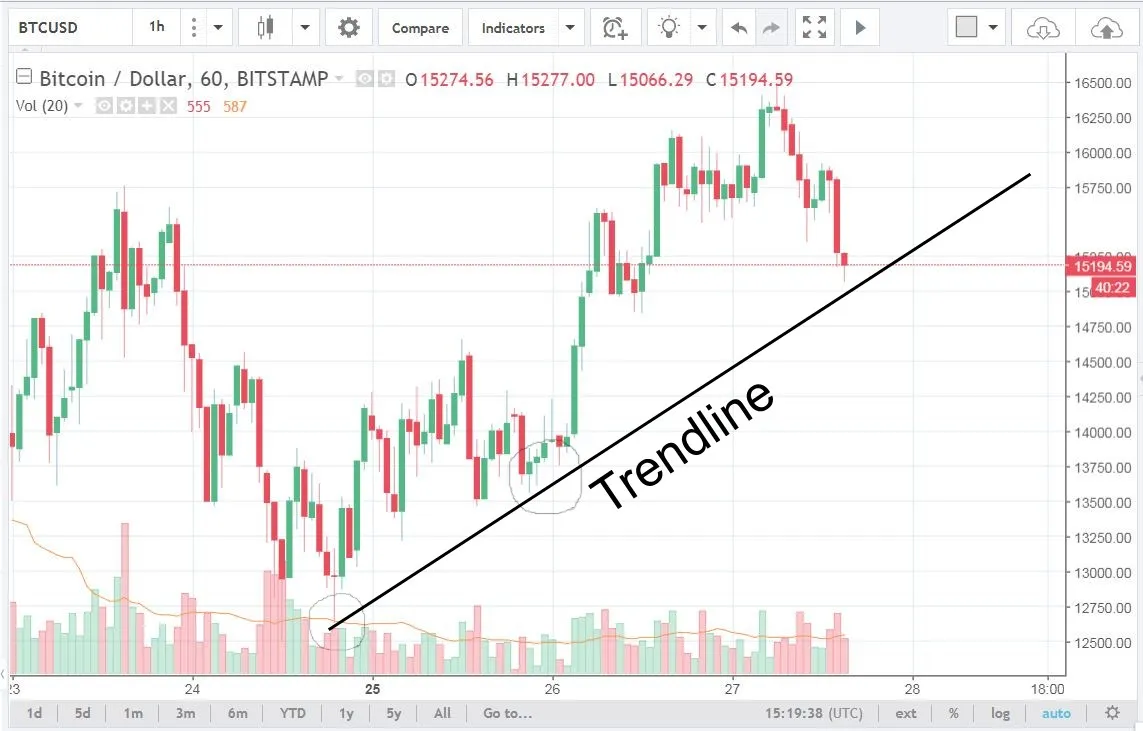
Lastly on Hourly chart we have market testing a trendline. This is where the short term market trend is going to be decided, if the market is not able to break the trendline then the price will again hit 16500 level.
If the trendline got broken then we are going to see head and shoulder pattern formation.
CMP 15300
Major Support: 13500 , 12500
Major Resistance: 16500 , 18000
Best buying level is around 13000-13500 level.
Please upvote and resteem.
Thank-you