Read an interesting post (https://busy.org/@bitbrain/bitcoin-trendline-analysis-latest-update)yesterday by @bitbrain from @TIMM (a trading analysis platform on steemit). It gave me a different perspective/sentiment of btc long term as I explore the log function on charts. Usually i will look at day and weekly chart, recently added my opinions for hourly timeframe too and post it on my daily analysis. Whenever i m looking at chart and doing TA, i always use linear. I'm aware of the log function but never really look at it.
During my initial journey on btc, i actually go study the full chart from bitfinex since 2013 and look for patterns as longer timeframe gives a different perspective and big picture possibilities. Reading that post, spark of my curiosity and interest on using the log function for btc chart, i will went to test it out on bitfinex not the usual coinbase in my analysis as the data on coinbase is lesser. Some interesting findings (turning on log function and set it to weekly candles),
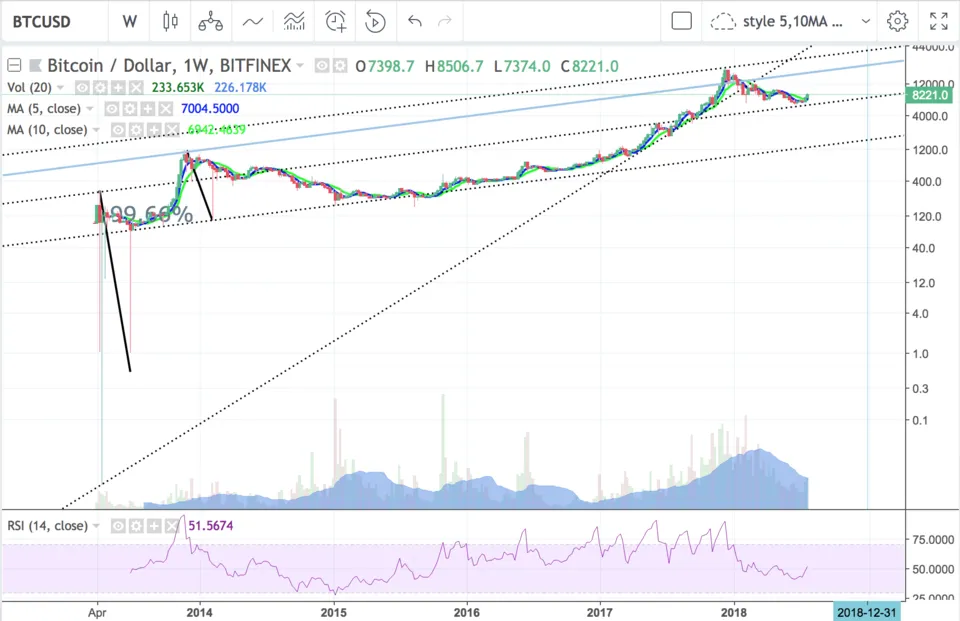
1)the lowest dotted line using 2 points to draw a line extension, note the 2014 super flash crash shadow bounce off this line and the bottom of the 2014 bear trend hover around that zone.
2)I did a clone of this first line and magically it fits (NO ADJUSTMENT), 2nd dotted line, to the top of 2013 and a nice channel formed from then till now, when price get too far off too rapidly from this 2nd dotted line like in 2014 and 2017, it will come back to test. In 2014, it hover for awhile before dipping into the channel.
3)When i did a clone of the 2nd dotted line, it's where you see now the 3rd dotted line, no adjustment too and we have the 2017 top.
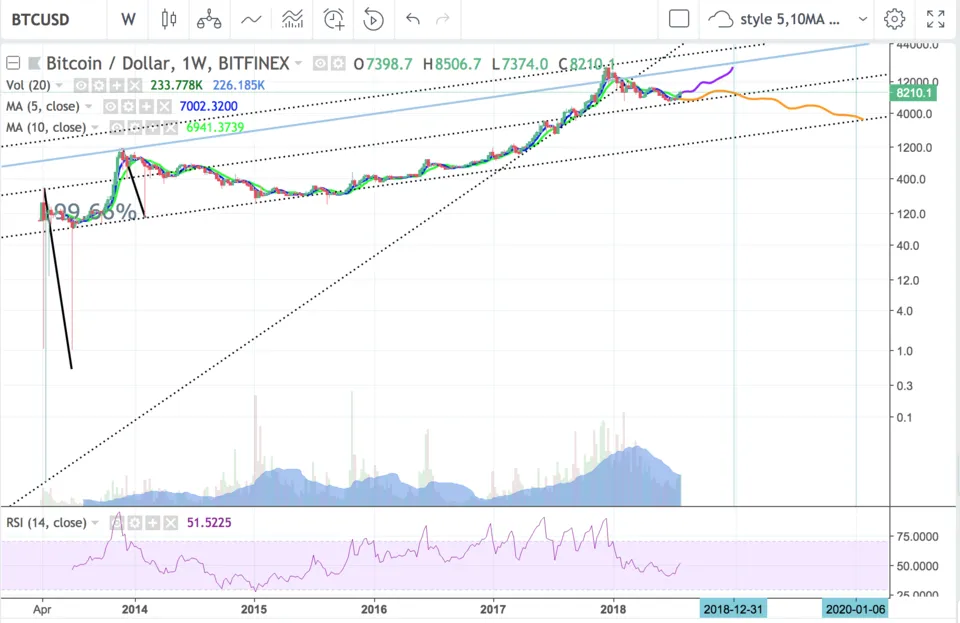
Bullish : Adding an additional blue trend line, possible to have btc price around 22000 end of 2018 should the rally pattern occurred like 2017. Or even better all the way to the 3rd dotted line top where we can maybe see btc price hitting 38000. (side note, i remember reading this 38,008 number for btc appearing on clif high report from the datasets processing) I wonder what news could drive whale's sentiment for this to happen.
Bearish : It could be a repeat of 2014 where it hover along the 2nd dotted line and dip into the channel and all the way till 2019 where we might see btc price at 3000 and really attract the whales to come in or where there's more time for regulation to establish + confident + profitability for financial institutions to enter.
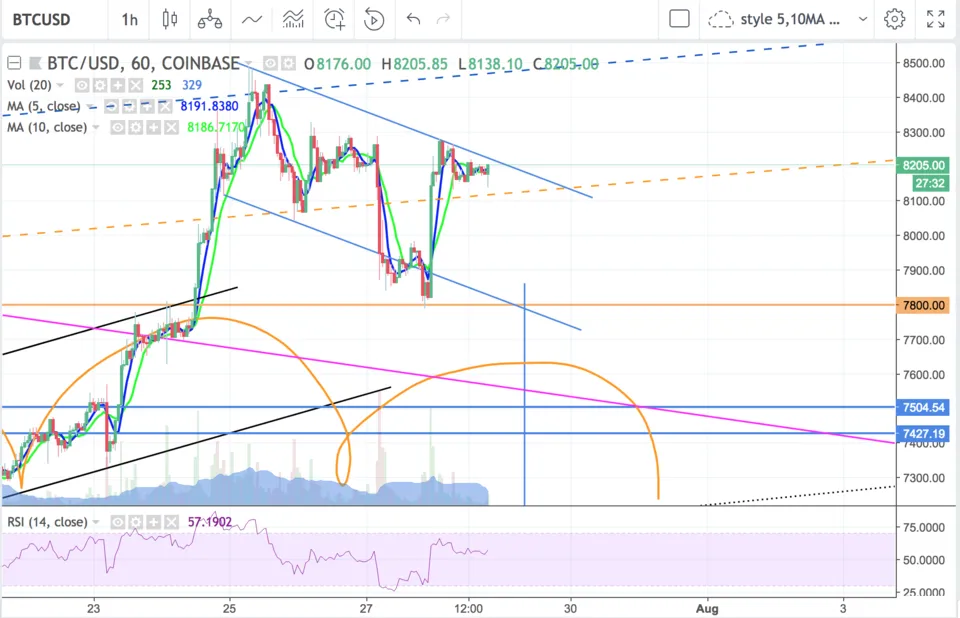
On hourly candles, tested the upper channel resistance mentioned. Consolidation within possible triangle, possible squeeze breakout either up (3 steps spike of the staircase pattern) or down.
News: -
Short term moving average (day candle) : uptrend
RSI : nearing overbought
Depth Chart : (S)7800, 8000 | (R) 8300, 8500, 8600
Weekly Timeframe :
Disclaimer : This is not financial advice, it's all based on my personal biased opinion. Do your own research and put in the amount you can afford to lose.

3 Ways to earn on steemit platform passively
- Sell your upvotes or lease/rent your SP from DLM market and earn passively with Minnowbooster service
- Sell your upvotes or delegate your SP and earn passively with Smartsteem service
- Get free upvote from busy.org daily and earn from referral bonus
Buy/Sell/Trade Altcoins
http://bit.ly/Binance-GetAltcoins
http://bit.ly/kucoin-GetAltcoins
Buy bitcoin easily, go for coinbase (you get $10 bonus) :
http://bit.ly/Coinbase-BuyBitcoinFastEasy
Earn Free bitcoin/satoshi and lottery ticket (it's kinda of slow, well it's free though and bonus if you win the lottery) : https://freebitco.in/?r=11267717
Earn Free bitcoin/satoshi from watching ads : https://ref.adbtc.top/637835
Get 3% discount when you buy Genesis mining contract using my referral code - HscXrw
Social Media
Steemit ► https://steemit.com/@onepercentbetter
Youtube ► https://www.youtube.com/c/1PercentBetterToday
Facebook ► https://www.facebook.com/1percentbettertoday/
Instagram ► https://www.instagram.com/1percentbettertoday/