Getting closer to the lower end of the sweet spot I mentioned yesterday:
https://steemit.com/bitcoin/@pawsdog/2-21-2018-the-market-view-and-trading-outlook
We may go a bit below, but I am now beginning to see larger buy orders attempting to start a rally at key trend lines and possible reversal points. In saying “larger buy orders”, as someone whom has watched 1000’s of hours of BTC charts over the last few years, what you will see is 300, 500, or more BTC market orders jump in at critical moving average crossovers, support levels, Fib levels etc. in an attempt to jump start a reversal. Generally while price is in freefall (just coming off a high) these massive buy orders are absent as those with tens of millions to spend have sense enough to know that price is pulling back and will wait until they feel they can trap and opposing whale and get the most bang for their buck and have a truly influential affect on the trend. This also occurs while price is going up, these same mega whales will make attempts to trap opposing whales, topple the market at key points along the way so as to buy back in at a lower price post panic.
In the world of BTC price, there truly is a strategic battle between Mega Whale Bulls and Mega Whale Bears, the rest of us are just along for the ride. Bear Whales whom desire a lower price will allow large buy orders, then instantly drop a larger sell order on top of it, pushing price well below the entry point of the previous buyer, this forces the previous large buyer to cover sell and add momentum to the decline; which is exactly what the Bear Whale wanted to begin with.
Think of it like this, price is moving up, it is well extended from Moving Average support levels. At this point a greedy Bull Whale decides he wants to pump price with a 400 BTC order and suck in the retail investors behind him. So he makes his order into an order book that appears light towards the selling side so as price will jump up a few %. He buys, then instantly liquidates, ¼ or so of his position back into the retail investors buying behind him. At this point a Bear Whale will drop a 700 BTC sell order into the now very thin buying side of the order book, which pushes price below the initial entry point of the Bull Whale. Feeling a possible reversal rejection, the first buyer liquidates his remaining 300 BTC to the selling side, and boom his 300 stacks on the 700 and you have a 1000 BTC sell order pushing price down well below the initial pump by the Bull Whale, hitting stops, panicking retail buyers starting a greater trend reversal.
The same will happen when Bull Whales want price to go up. They will leave an empty order book allowing a large sell order only to counter with a huge buy order, forcing the previous seller to buy back in and add momentum to the upside. One thing to look for when watching the charts is large buy or sell orders that have little effect on price and are immediately countered by a larger counter offer. If you see a 500 BTC buy order at a possible top that does nill to price and then see a dump sell of equal or greater size, you are probably looking at a strategic reversal in the works. Same thing on the bottom, large sell order with little effect, then a huge buyer order immediately after.
Alright enough of the lecture, for those new to reading my analysis I tend to go off on a tangent at times.
Moving on to what we can expect from BTC today.
As I stated yesterday, much will be learned from how BTC interacts with the 4 hour 77 period moving average, how the 4 hour 77 converges with the 1 day 21 and MACD 12 hour 0 line. Price briefly touched the 4 hour 77 at $9818 and was met with a 400 BTC buy order in an attempt to fuel a rally, that has as of yet not materialized. While I feel this may be a decent bounce point, and that price will likely recover past this level at some point, I also feel that price is likely to go a bit lower first; closer to the $9500 or so I mentioned yesterday. My rationale is that we have yet to come back and retest support at the 6 hour 77 period moving average since breaking above it at $9176 on Feb 14th.
Price in the vast majority of scenarios ALWAYS, ALWAYS, ALWAYS comes back to test a major Moving Average for support after breaking above it. Currently the 6 hour 77 is around $9170 and will incrementally creep upwards so long as price stays above till a point that they meet. Give it another day or so and it should be around $9300-$9400 which will also be the 1 day 21 period moving average, possibly the 12 hour MACD 0 line and just enough below the 4 hour 77 so as to give us rebound momentum to the upside.
All that said I’m going to wait a bit more and see what occurs, if we head down around $9600 or below I may start to ladder in and incrementally purchase. If the trend stops here at the current price of $9850, I will wait until I have confirmation of reversal on the 2 hour and buy in there.
What do the charts say..
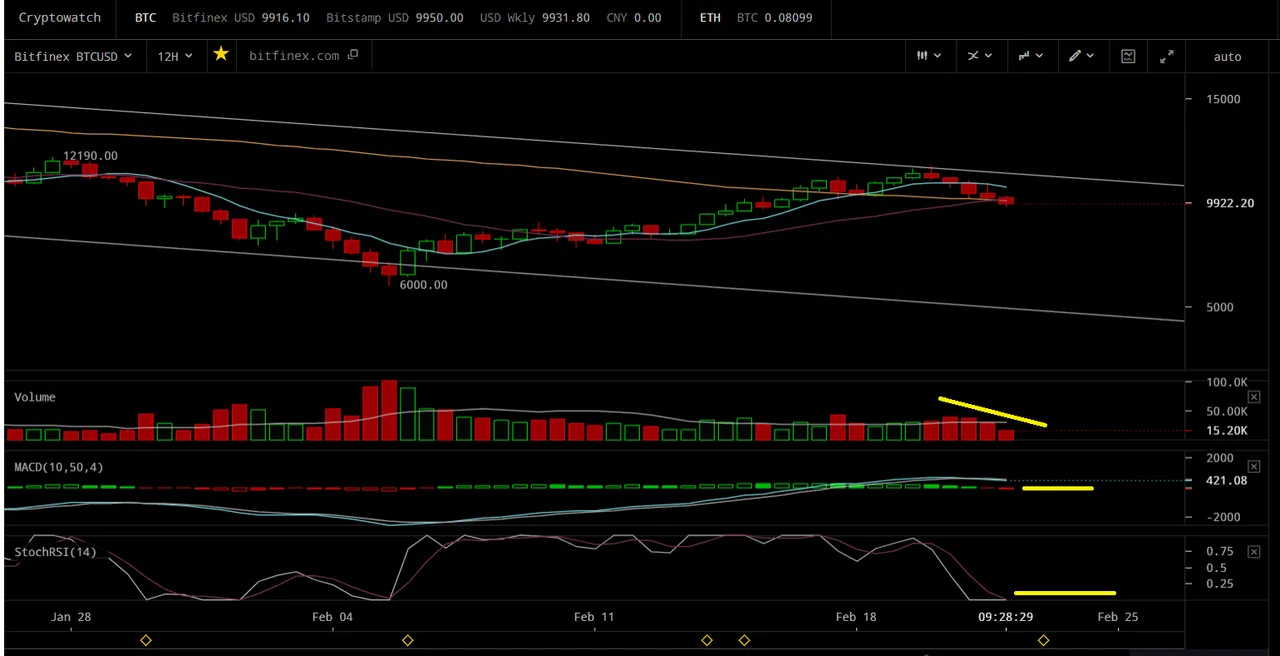
The 12 hour RSI has us entering oversold territory, and we are likely to remain here for a bit which is healthy. So for the next 24 to 48 hours I expect price to limp around in the mid to upper $9,000’s. In a healthy market, on a normal pullback you generally get 4-6 red bars on the MACD histogram, we are currently at 2, so we have some more downwards price action or sideways trending ahead of us. We are beginning to approach key reversal points as price continues is decline and resistance to the downside will grow incrementally stronger as price declines closer and to longer term moving averages. Price is currently basically sitting on the 12 hour 77, its first retest of it since breaking above it. Also of note, it is testing the 12 hour 77 at about the same time as the 21 MA is crossing above the 77 which is also a normally bullish and healthy sign of a pullback/consolidation. You often the 7 MA break above the 77, then price will fall back to the 77 thereafter to test support at about the same time as the 21 crosses above from below; normal, and a routine occurrence in all time frames. The 7 will then bounce the 77 as price moves higher after having fallen slightly below the 77 to drag down the 7. At which point price shoots toward a new high. So expect a good dip below the 12 hour 77, again towards $9500-$9600 to drag the 7 towards the 77 for a bounce upwards.
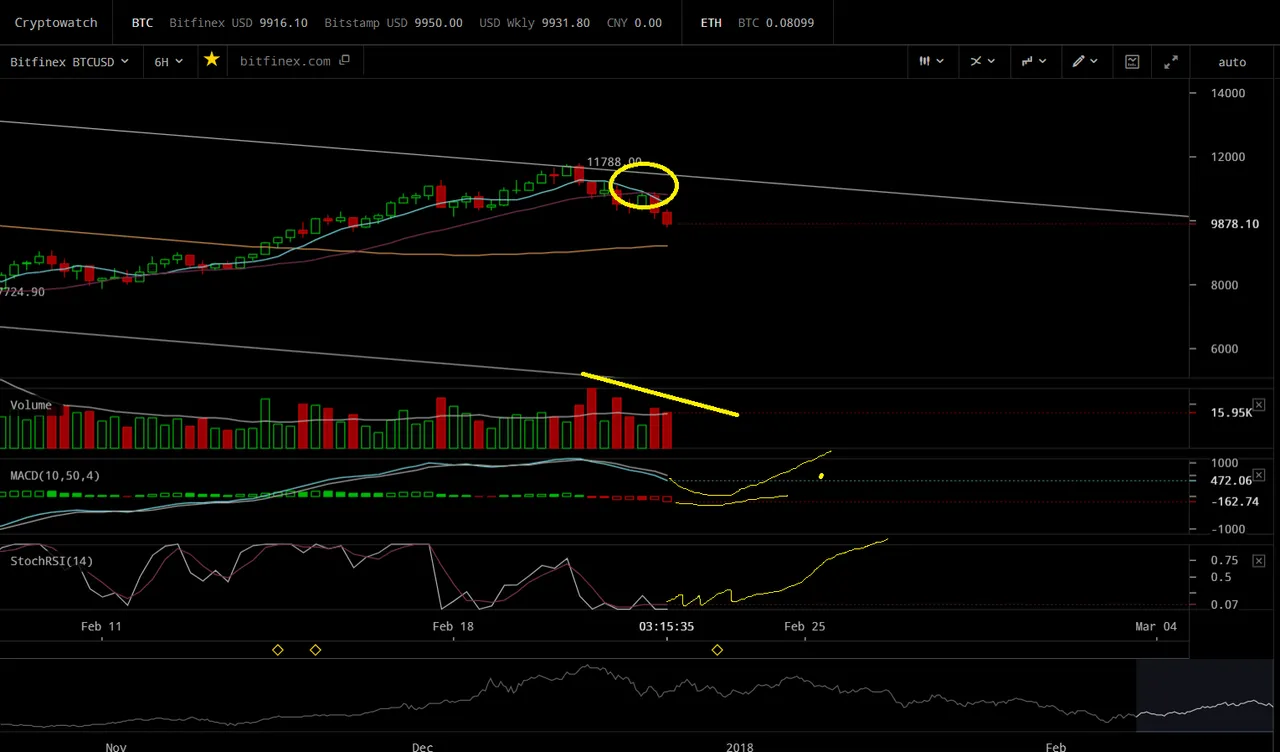
Price is approaching the 6 hour 77 period moving average and will likely hit it based upon the 7/21 downwards cross (yellow circle) which should provide the necessary momentum to hit the 77 and test it for support. RSI has us nice and oversold, we have been since $11,000 or 6 periods which is ample time for a minor upside reversal. What I expect to see is a bump up on a mediocre buying period followed by another sell, some sideways action and recovery. Guestimating would be afternoon or late evening tomorrow for some seriously positive action toward the upside.
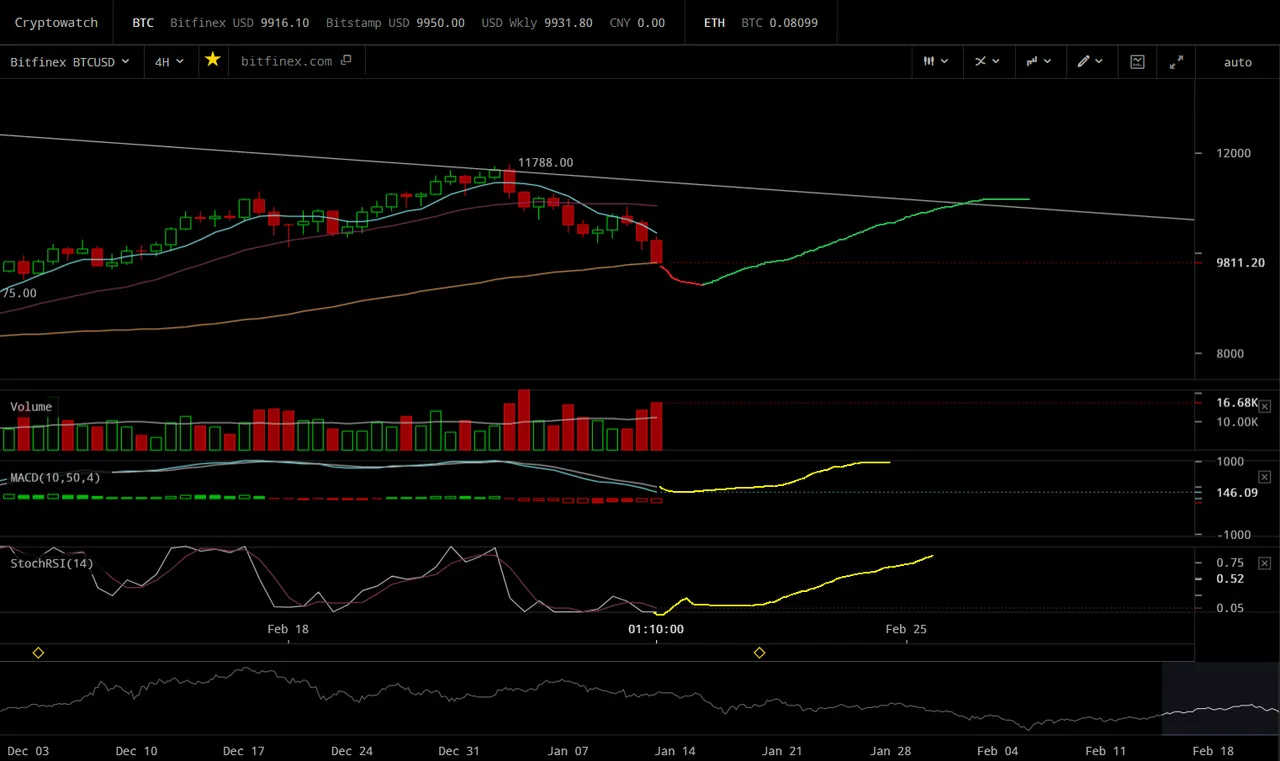
Price is now resting on the 4 hour 77 and will likely dip below thanks to the 7/21 downwards cross on the 6 hour. RSI has us oversold, and we will have support at MACD 0. Objectively all things for the moment point to a reversal in the $9300-9500ish zone; accordingly I will wait it out a bit.
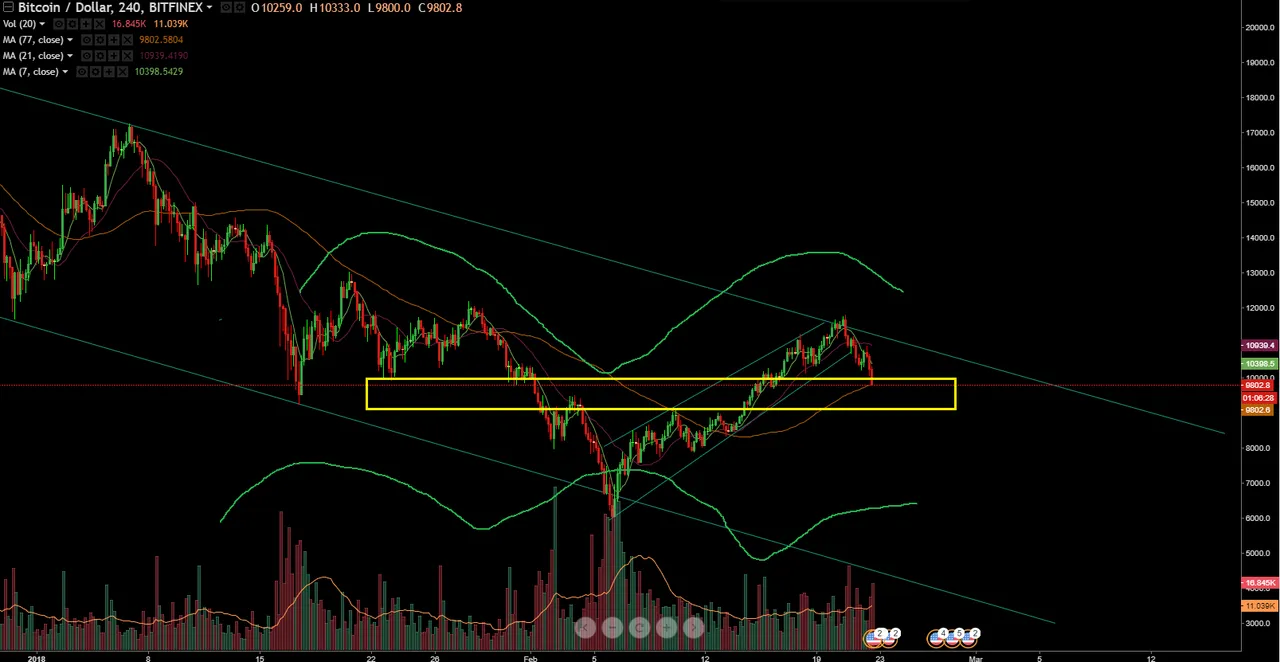
Lastly, everything from yesterday ( https://steemit.com/bitcoin/@pawsdog/2-21-2018-the-market-view-and-trading-outlook ) is still on the table in regards to the sweet spot for buying an inverse head and shoulders as well as a potential downwards channel. Of note, volume is beginning to look as though it would like to confirm the inverse head and shoulders; though we still need a bit more volume on the right shoulder for the pattern to be complete.
Also good to see haejin caught up today with my analysis and $9500 price points from yesterday
https://steemit.com/bitcoin/@haejin/bitc-btc-morning-update-tree-count-vs-forest-count… lol)
Also good to see him toot his own horn about the inverse head and shoulders yesterday stating he had been talking about it for a few days.
https://steemit.com/bitcoin/@haejin/urgent-bitcoin-btc-evening-update-critical-juncture-reached
Just a bit behind the power curve as I noted the beginning of this pattern forming 2 weeks ago:
https://steemit.com/bitcoin/@pawsdog/2-10-2018-the-market-view-and-trading-outlook
Well back to building a duck pond for me…
Lastly for Alt Lovers.... Check NBT (Nubits) in times of BTC correction, you may like what you see...
My Previous Analysis:
https://steemit.com/bitcoin/@pawsdog/2-21-2018-the-market-view-and-trading-outlook
https://steemit.com/bitcoin/@pawsdog/2-18-2018-the-market-view-and-trading-outlook
https://steemit.com/bitcoin/@pawsdog/2-13-2018-the-market-view-and-trading-outlook
https://steemit.com/bitcoin/@pawsdog/2-10-2018-the-market-view-and-trading-outlook
https://steemit.com/bitcoin/@pawsdog/2-7-2018-the-market-view-and-trading-outlook
https://steemit.com/bitcoin/@pawsdog/1-29-2018-the-market-view-and-trading-outlook
https://steemit.com/bitcoin/@pawsdog/1-27-2017-the-market-view-and-trading-outlook
https://steemit.com/bitcoin/@pawsdog/1-26-2017-the-market-view-and-trading-outlook