
It’s fun to estimate price movements of assets in general. It’s especially fun to speculate on Bitcoin because of its extreme price movements. The price movements are also nothing new and shouldn't deter you from investing in Bitcoin for the long run. Where is Bitcoin’s top this time around? How do we know we aren’t there already? If you believe in Bitcoin's fundamentals, it may be better not to worry and just buy and hold for the long run. Buying and holding, accumulating and dollar-cost averaging are probably the best strategies for most people, especially for those without a lot of time.
Technical Analysis
For us speculators, one of the methods people use to try to predict price movements is called technical analysis. Technical analysis is simply a method of trying to predict future price movements simply by looking at past prices. The idea that technical analysis can help is contrary to the random walk or efficient market theory that suggests that past prices can’t be used to predict future prices. Most academics and finance professionals subscribe to efficient market theory and it would be hard to argue against them since there are only a handful of cases of those who have used technical analysis with great success. To be fair very few consistently outperform the average using fundamental analysis and efficient market theory applies to fundamental analysis in the same way. Yet fundamental analysis has a much better reputation. Professionals associate technical analysis more with witchcraft or voodoo magic. I would guess over 99% of speculators that use technical analysis underperform those that buy & hold after trading fees & taxes. However, perhaps there is about 1% of those that use technical analysis who are able to use it to gain a consistent edge, especially if random walk theory isn’t quite valid.
there's something called the efficient market theory which says that there's nothing in the data, let's say price data, which will indicate anything about the future, because the price is sort of always right, the price is always right in some sense. But that's just not true. So there are anomalies in the data even in the price history data...
-- billionaire Jim Simons, Renaissance Technologies, one of the most successful quant hedge funds in history.
So I wanted to do a blog series on technical analysis to cover some of the most common indicators and strategies and hopefully give those that are open-minded an edge in their trading.
Support & Resistance Levels
The first basic concepts I wanted to discuss are support and resistance levels. A resistance level is a price ceiling that people believe to be difficult for an asset price to go above. A support level is a price floor that people believe will be difficult for an asset price to go below. Oftentimes an asset achieves an all-time high price due to some fundamental news or irrational exuberance and subsequently falls significantly. The all-time high price creates a level of resistance that is difficult to surpass unless there is more exuberance, fundamental drivers or broader interest than what took the price up to a previous high before. When an asset price breaks above an all-time high, that all-time high price becomes a support level that future prices should stay above in a general uptrend. On the other hand when an asset price breaks sharply below longer term lows (ie. support levels), a resistance level is created that could be part of a longer term downtrend.
Right now Bitcoin is at its all-time high. Its previous all-time high before 2017 was in 2013 when it reached roughly $1160. When prices broke above the previous all-time high resistance level that was likely a good signal that another Bitcoin boom was coming.
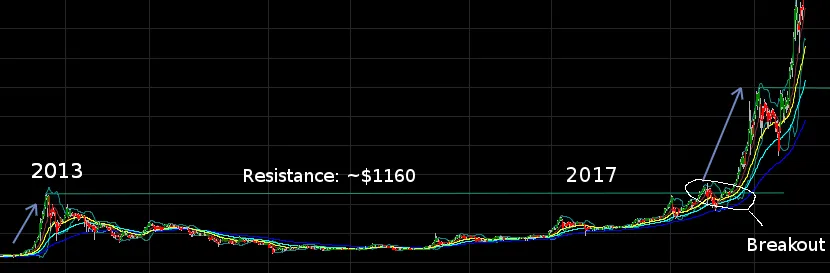
In March of 2017, Bitcoin broke through the resistance level set in 2013 to reach all time highs to $1,350 on expectations of an SEC approval for a major ETF. However it broke down below the new support level (ie. previous all-time high) once the ETF was rejected. In just a month Bitcoin prices crept back up over the resistance level, suggesting the ETF news was not that significant overall. Once the prices remained above the previous resistance level for over a week it quickly surpassed the more recent $1,350 high resistance level in March and broke out to just about $3,000 in June.
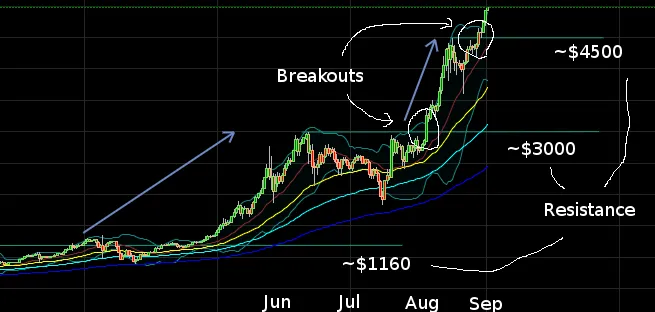
Above is a Bitcoin chart for 2017 that shows shorter term resistance and support levels. You can see the large price move from about $1160 in March to $3000 in June (before the hard fork in August). After segwit activation and the Bitcoin Cash fork I thought we were in the beginning stages of a crypto-bear market and that there wouldn’t be enough momentum to go beyond $3,000 in my previous blog post, but once it broke past $3,000 with incredible strength I was bullish again. In the last post I wrote “The upside is Bitcoin seems to finally be moving past a multi-year standstill on Segwit & hardforks. That may be a huge relief to the Bitcoin community. Will that be enough?I don't think so, but I'll change my tune if Bitcoin breaks all-time highs with some good strength.”
The reason I made that statement was precisely because I favor using resistance levels and breakouts during large moves such as the one Bitcoin currently is in. Bitcoin broke the $3,000 resistance level with strength. Just recently the price hit $4,500 to set up another resistance level, prices subsequently fell, but there was another break out in the last few days and is moving upwards with continued strength.
So how do we trade using these support & resistance level concepts?
You can use resistance levels as a momentum strategy. When prices break through resistance levels to new all-time highs you can get in early and ride the move upward. For safety you can also set up stop-losses below previous all-time highs because previous resistance levels turn into support levels.
On downward or sideway moves, you can also sell an asset when it gets near resistance levels just in case there isn’t enough momentum to break through them with strength.
I’ll be talking about moving averages, RSI, oscillators, volume indicators, bollinger bands, fibonacci retracements etc. and apply them to Bitcoin and other cryptocurrencies. Will Bitcoin hit $10,000 in a month? There seems to be considerable momentum for that to happen so I’ve been bullish after it broke $3,000. Keep your stop losses below significant support levels and might as well ride the wave to see where this goes right?
So what are your thoughts about 1) Bitcoin prices 2) technical analysis in general?
Note: This is for educational purposes only.