BTC as I'm sure you're aware has seen large decreases in price action recently. However, there are many arguments to be made to support that this is a temporary low and we will soon see higher price action (at least to 7K regions). However, it is unlikely that 5.7K will be the lowest point we reach this year.
The following charts will highlight indicators that suggest we have reached a temporary bottom.
Chart: 1
Bitcoin has historically found support on the EMA's as shown through green highlights on the chart.
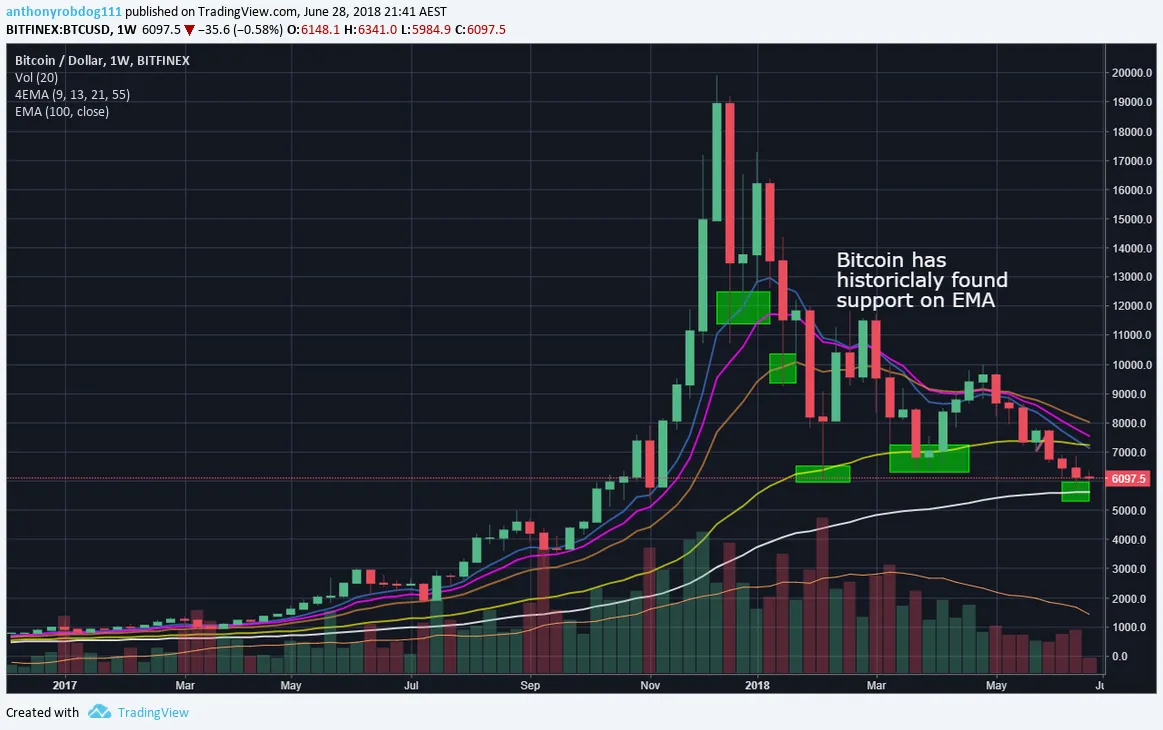
Chart: 2
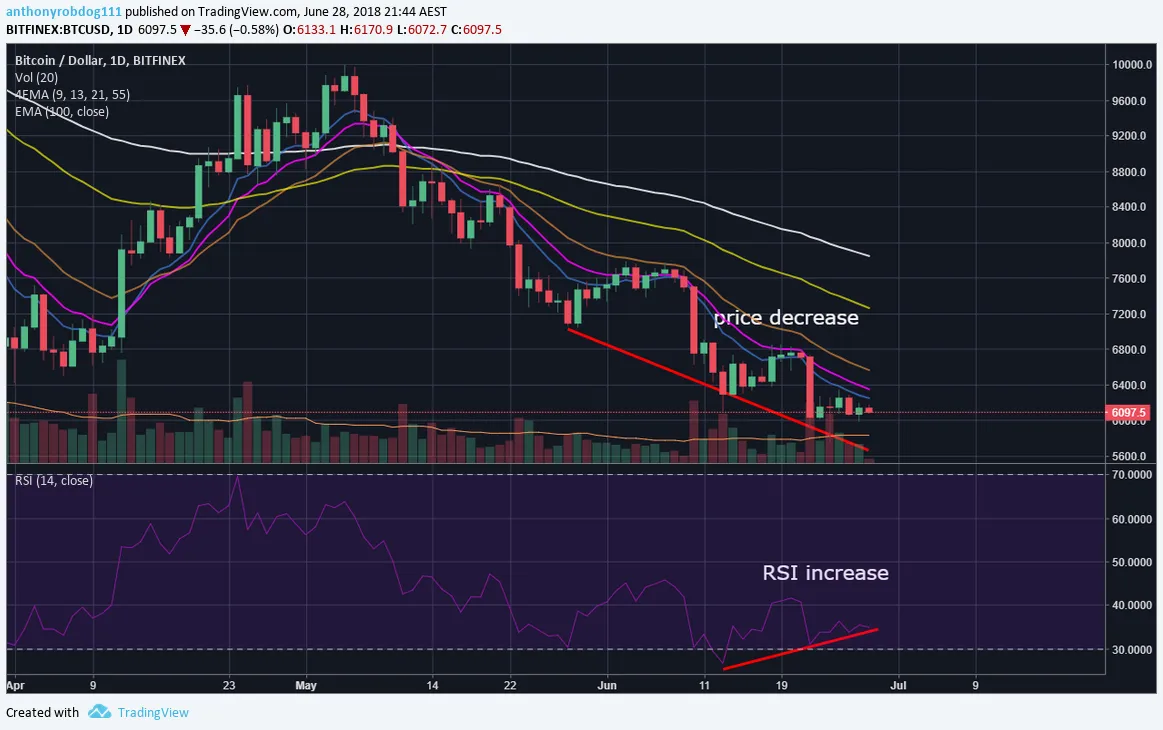
There is strong RSI convergence following browns RSI rules. This states that if RSI increases, and Price action decreases this is likely a leading indicator in picking a reversal. This is detailed further in my most recent post.
Since then, the price action confirms this BULLISH convergence and has formed an RSI trend line.