Ok we have a clear breakout!
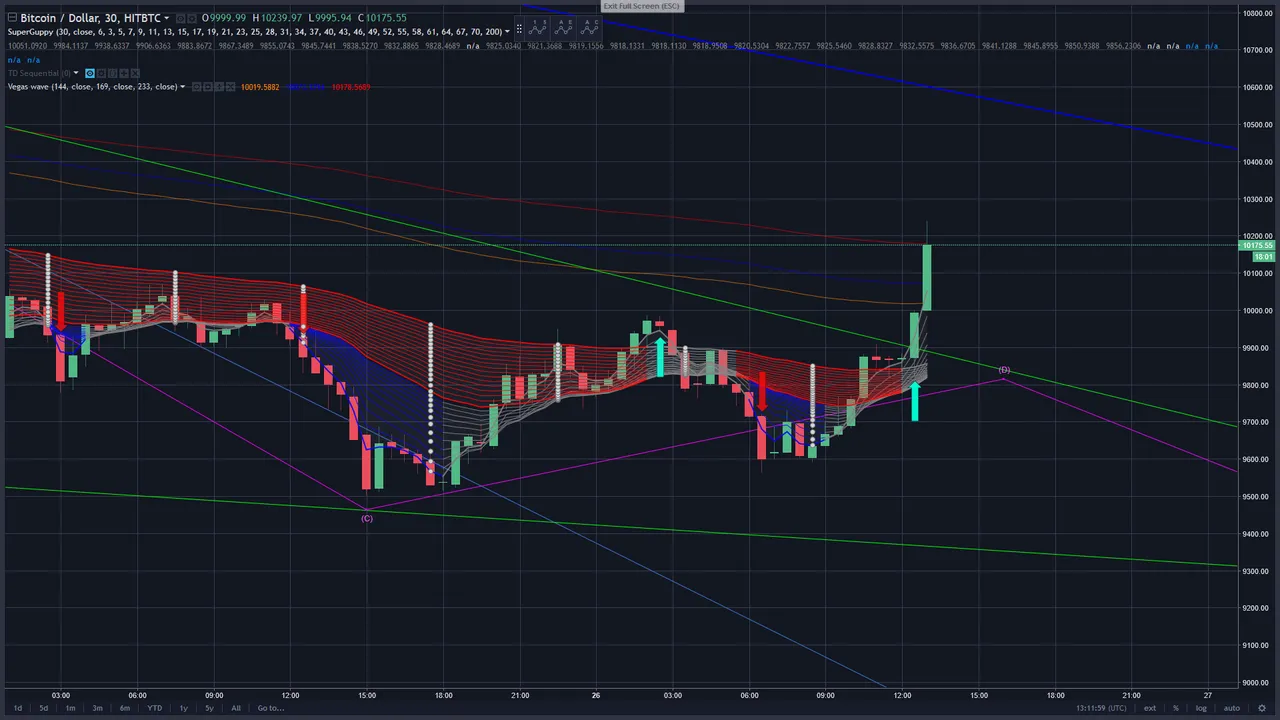
I actually noticed this on another great indicator, @haejin, just after posting my LTC vs BCH post. After adjusting the anchor timeframe on the Superguppy, it show an aquacolored arrow under the signal candle.
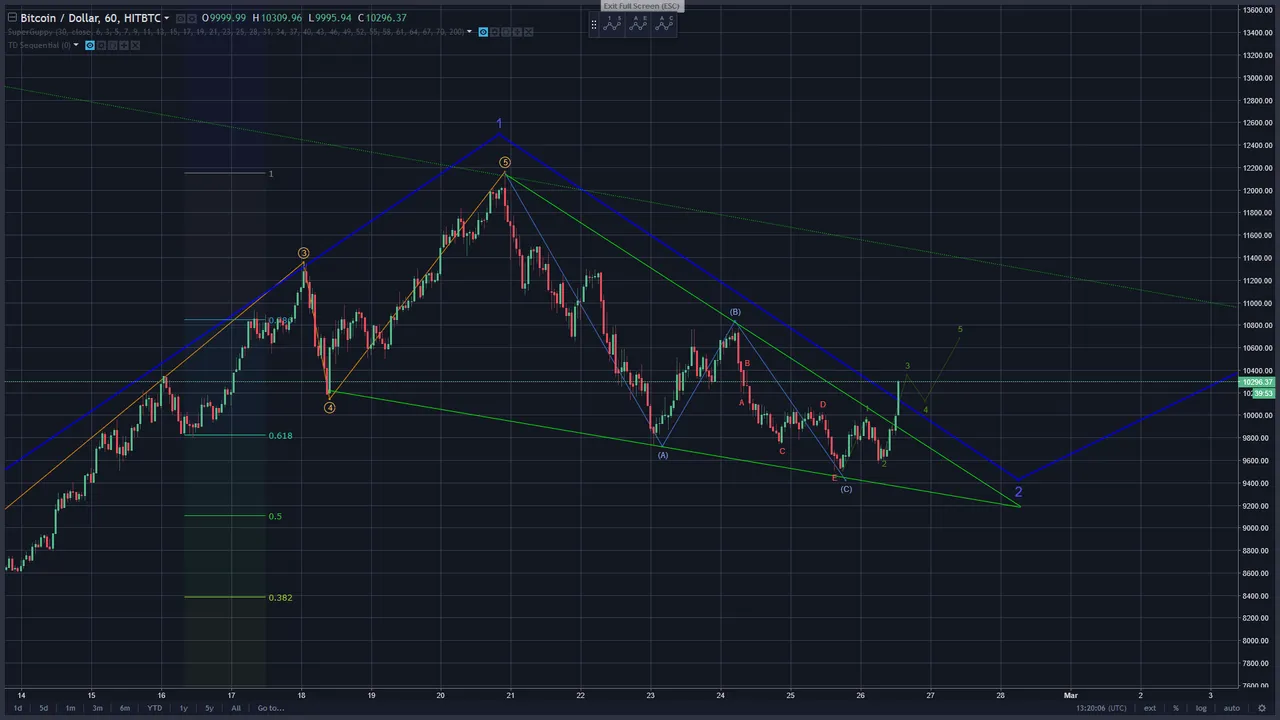
The E wave in the triangle never came, but as we can count 5 waves in the C wave that's ok. The correction is an ABC, the most common in 2.wave corrections.
These are just my thoughts, not a trading advice.
If you have another view on this charts your welcome to discuss and post your charts in the comments.
Comments are highly appreciated, and please
upvote, resteem and follow me if you profit or otherwise enjoy my posts !
If you feel like buying me a beer,just send me some STEEM :)