BITCOIN - BEARS VS THE BULLS!
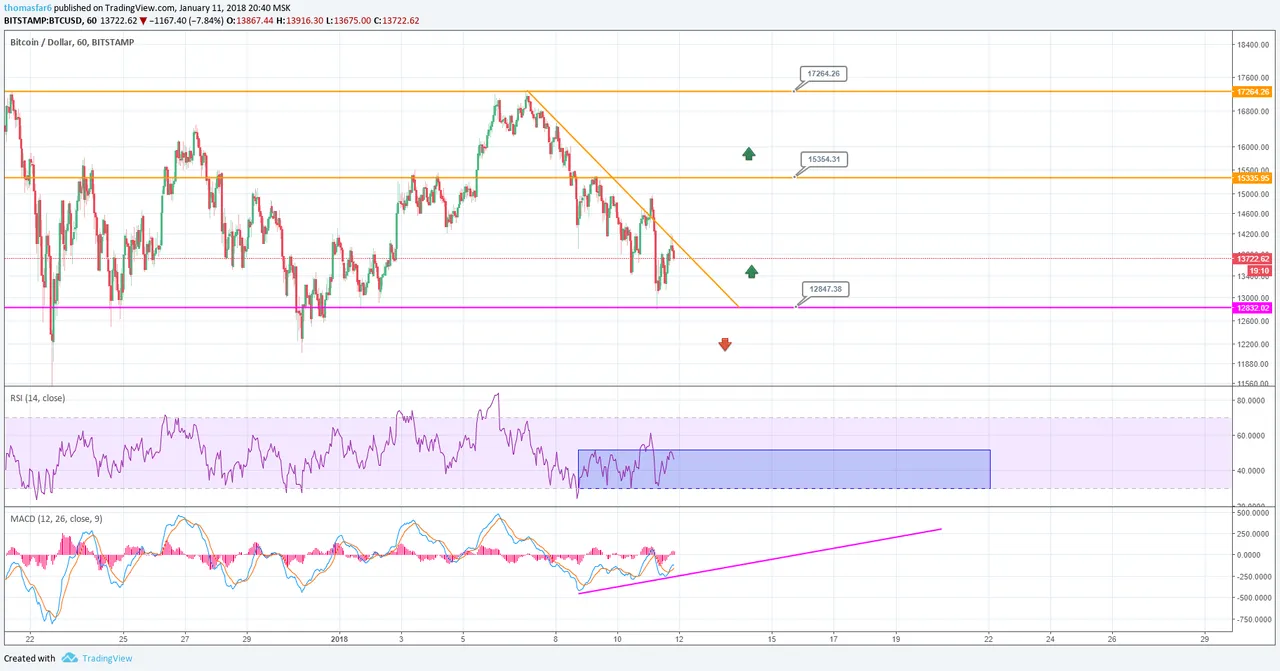
These graphs show the key resistance and support lines that Bitcoin -7.98% has formed over the past few days, you should use these in order to leverage your trades. You can expect that we will take a short-term dip to the support line, where we may consolidate and make another move upwards which will break through the horizontal resistance. This would be a confirmation to go to our second price. However, if we break below the support you could expect to see another decrease incoming.
Link to analysis- MACD - Looks more on the bullish side, we have a created a support level on the MACD , this is a good sign and we have not seen this in BTC -7.98% for a while.
- RSI - Is consolidating or fluctuating between the blue rectangular box, this shows that trading is very tight and there is a period of steady buying and selling. Usually an indication of an upcoming breakout or breakdown.
- Orange - Resistance.
- Pink - Support.