BITCOIN - The Trend Continues.
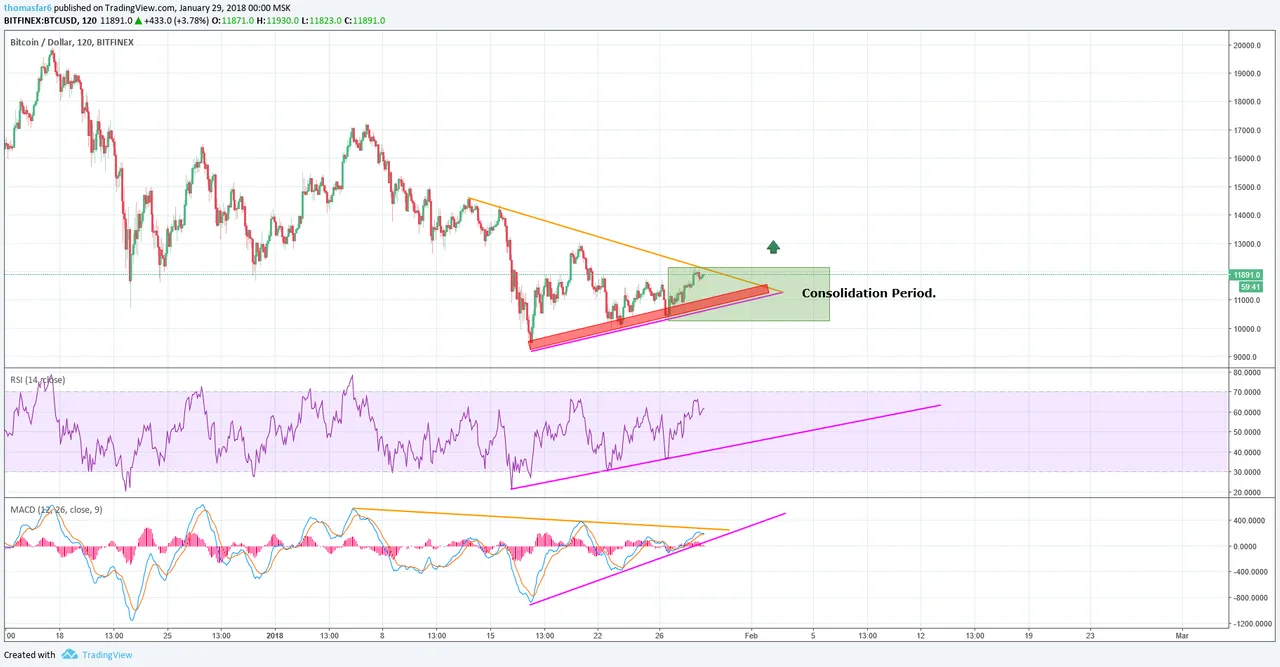
From my previous analysis (which you should check out on my page), we have kept the symmetrical pattern intact and so far Bitcoin 3.81% has remained bullish (As my last TA indicated it would. "TA - Technical Analysis"). Now, this is similar to my last chart, however, the pattern has slightly changed. We now should look at the red rectangle as a point for optimal buy entries as that is where the support lies for the price (which also tells us we may see a short-term dip on Bitcoin 3.81% in the upcoming days to return to this line which would be around the high $10,000's). Currently, the market is fluctuating between the resistance and support but also should be seen as a period of consolidation which is usually a bullish trend , once this consolidation begins to fade it is likely that the price will see an increase in value.
Link to analysis- MACD - A nice support has formed on the RSI , we could expect for the price to touch down on this before continuing the trend higher.
- RSI - similar to the RSI heavy supports have come into play and are acting a barrier to hold the Bitcoin 3.81% price up, this is a good signal.
- Orange - Resistance.
- Pink - Support.
As always trade the lines accordingly.