Many posts I have seen regarding the exceptional oversold condition of the RSI Indicator which we have never seen before in the Daily Chart.
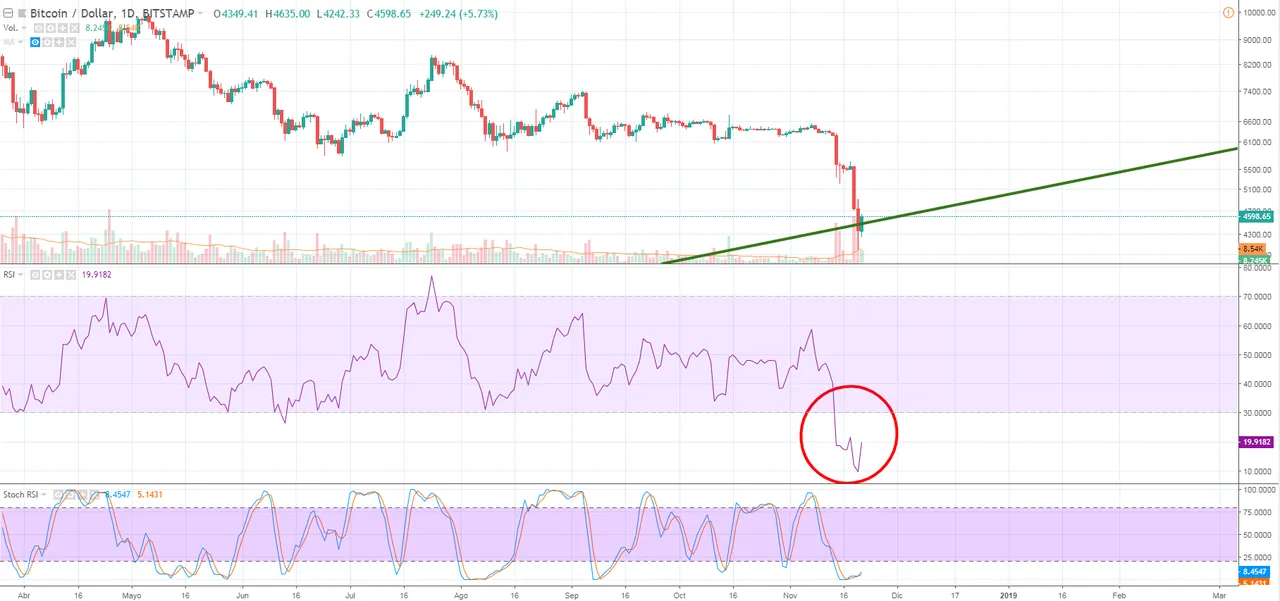
Actually, we may identify the historical start of a Bull Condition if we observe the Daily Chart combining the RSI and the Stochastic Indicators and we may say that "every time the RSI and the Stochastic oscillators present an OVERSOLD condition, it is very likely that a reversal of the downside move is starting"
... so what about now, is BITCOIN going to reverse the Bear Market imminently?
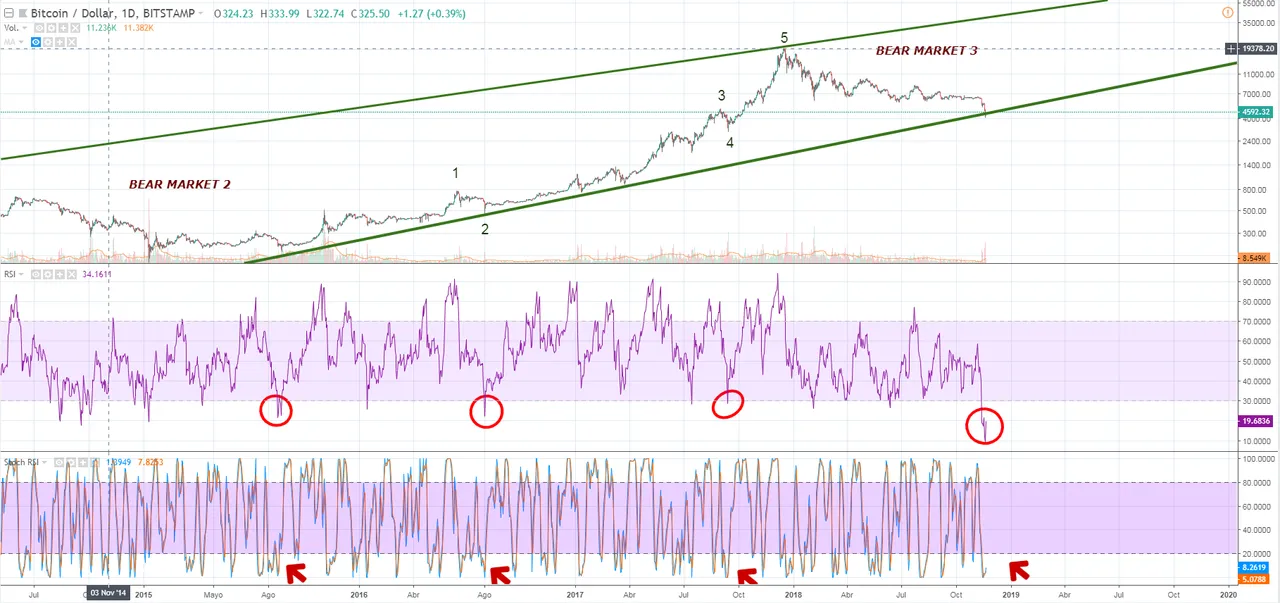
Can we extend this "theory" looking the Weekly Chart?
As you can see below, the only time on which both conditions were aligned was on January 2015.
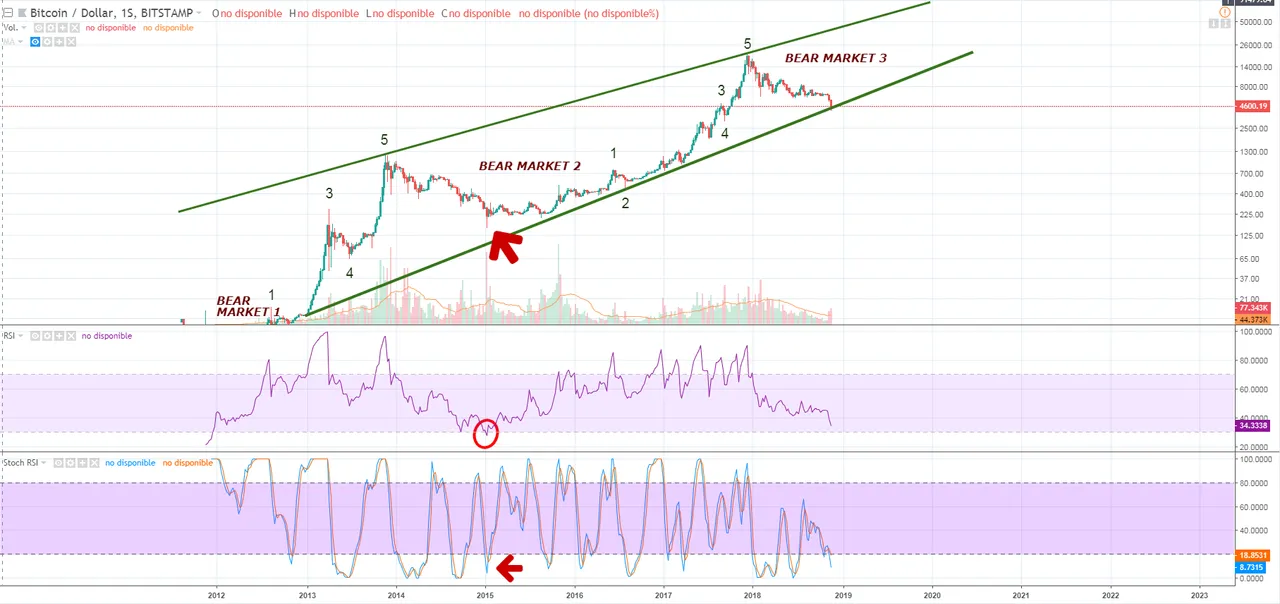
The BEAR market reached its lower point of 157 USD at that moment, retracing more than 85% from its top (around 1200 USD).
The current BEAR market has retraced only 80% from its top.
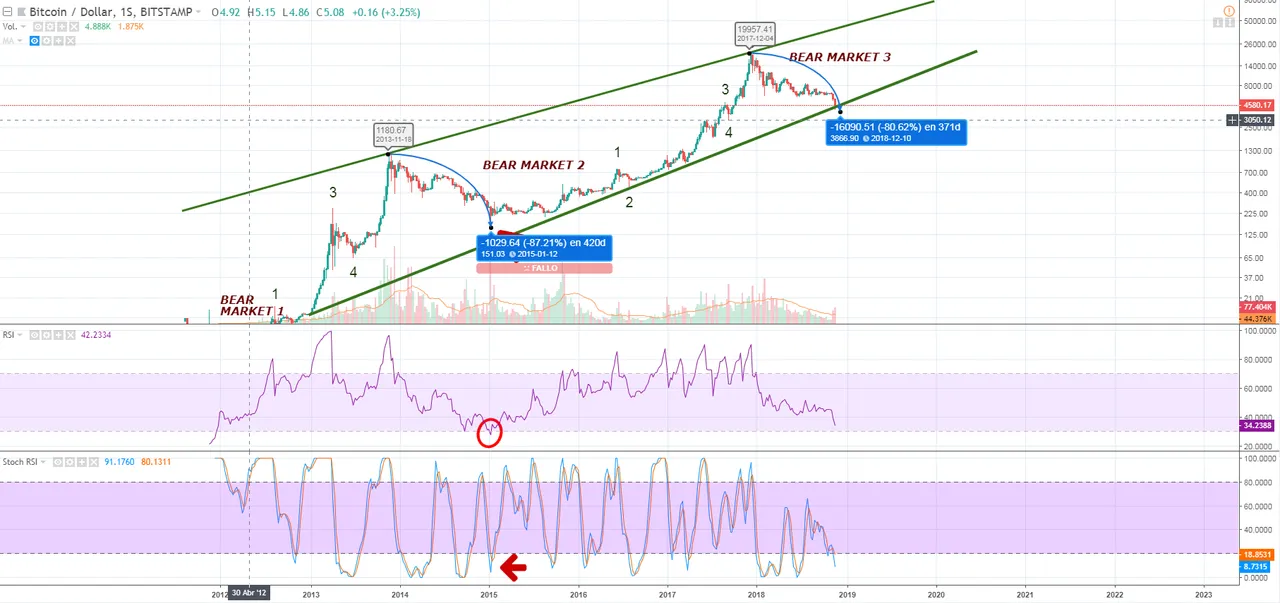
Just one condition has been reached, the STOCHASTIC is oversold but RSI is not.
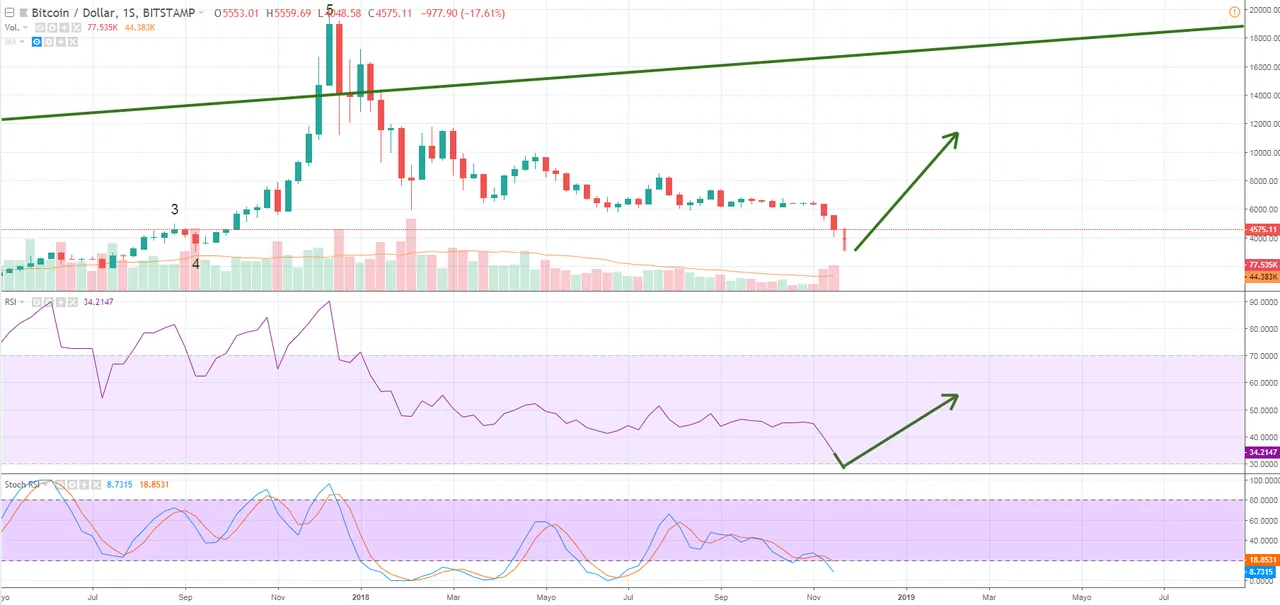
According to that, seems that the most likely scenario will be a lower low coming within a week or two and, in order for the RSI to reach an oversold condition at the weekly time-frame, it seems that around 3000 USD may be our more secure support.
 .
.
Just take it as a possibility.
*Disclaimer: This is just my personal point of view, please, do your own assessment and act consequently.
Neither this post nor myself is responsible of any of your profit/losses obtained as a result of this information.
Published on

by toofasteddie