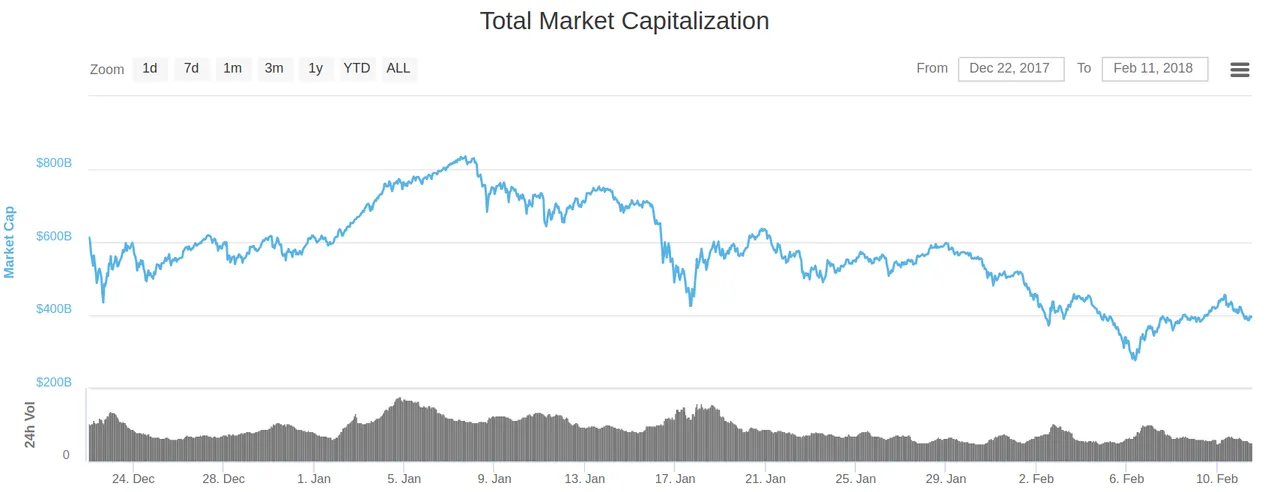
As explained in ''Masturbations'' (or Trading Discerniments) about the Total Coin Market: are we able to ''read'' the market? , let's see if we can "read" the movements of the "Monster" aka, the whole Market:
This is the evolution right now since December 20th:
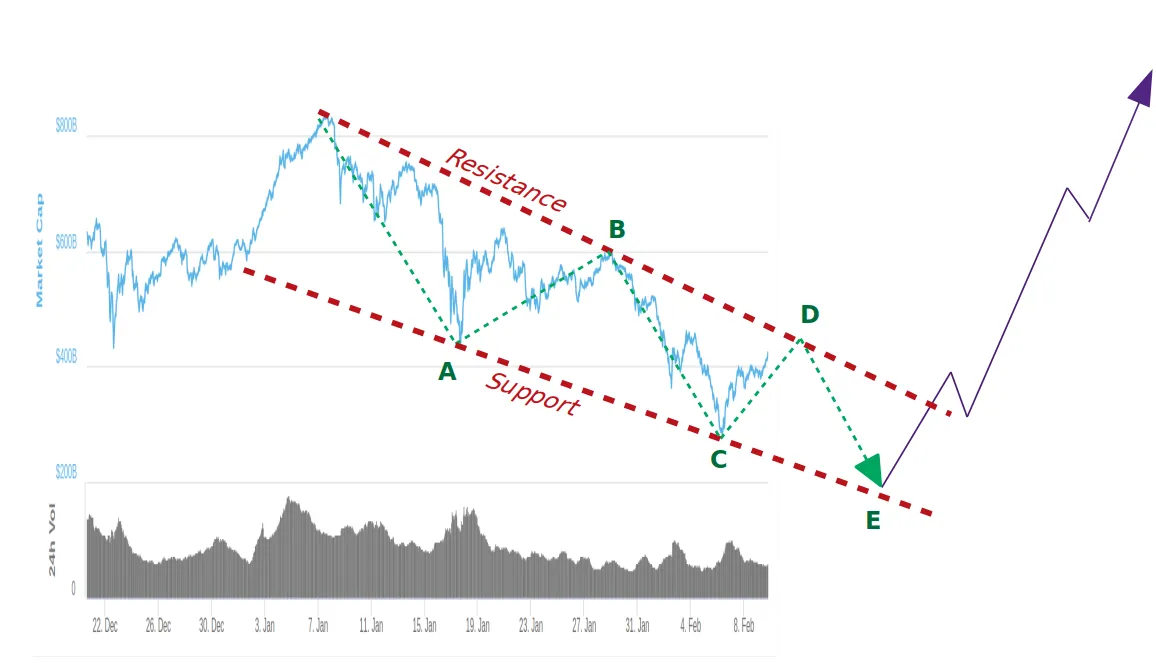
As forecasted in the previous post, the "Monster" is playing with an Upper and a Lower lines, the so-called Resistance and Support.
- Two days ago the situation was:
- Today the situation is:
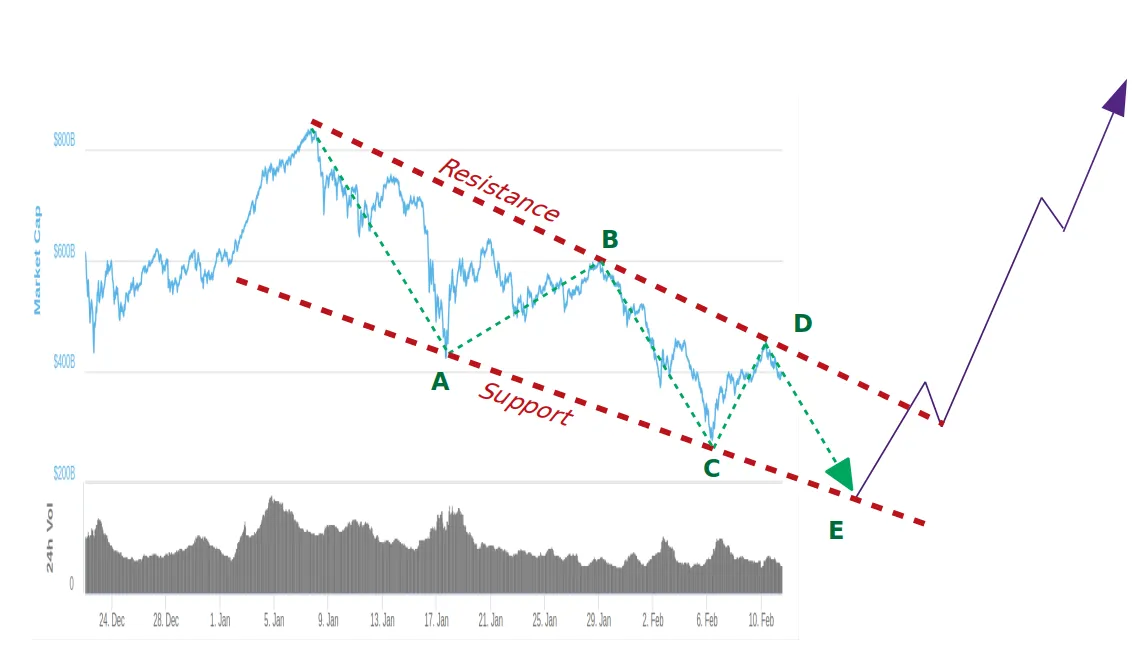
So, the "Monster" has clearly rebounded on the sketched Resistance Line by "D" at 458B$ and is now going steadily to find some support downwards.
Hope the monster will find that support before reaching the red-dashed line I draw because if it rebounds on E it will mean to be below the 200B$ of total capitalization.
Nevertheless, I wonder if maybe the Red-Dashed Upper Resistance is our best reference to declare a consistent end of the correction...
If so, we just need to see a strong breakage of that line!
Enjoy Cryptoland!!!!