Resuming my TA "masturbations" I started a few days ago, taking as a Timeframe the interval from December 20th till today of the Total Market Chart as the so-called "Monster", the Chart looks right now like this:
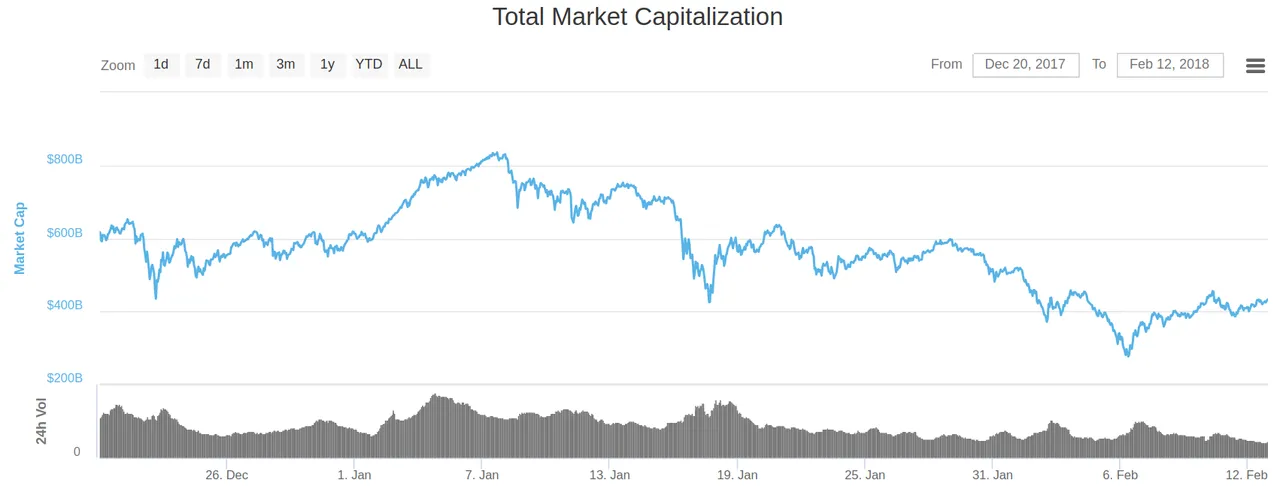
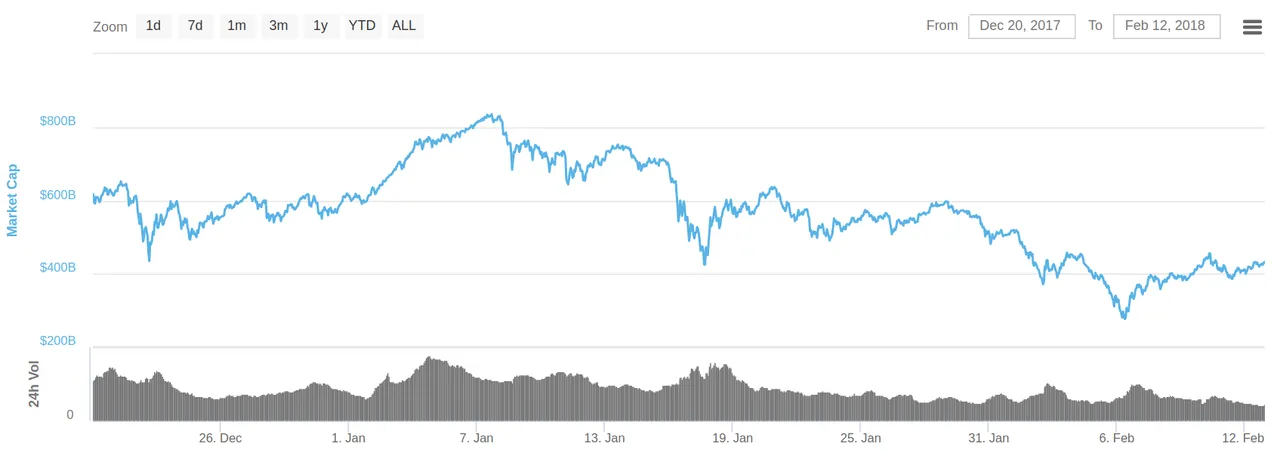
As usual, resizing the frame of the chart in order to magnify Y axis vs X Axis we got:
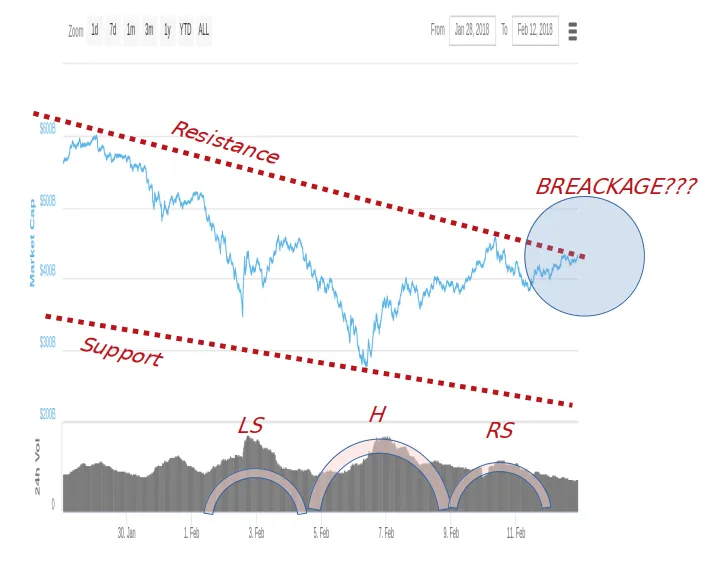
Then, drawing the support and Resistance lines :
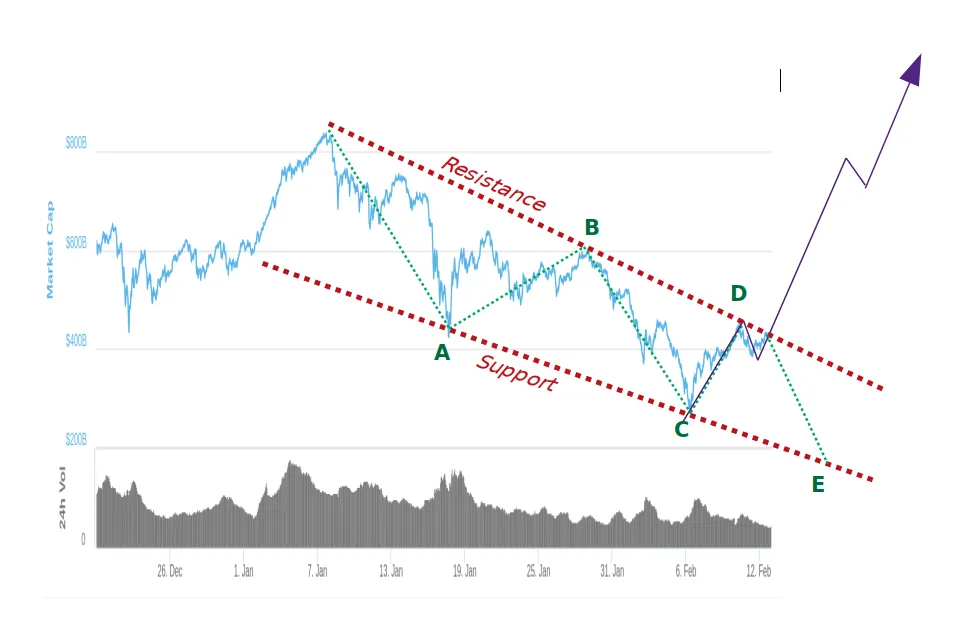
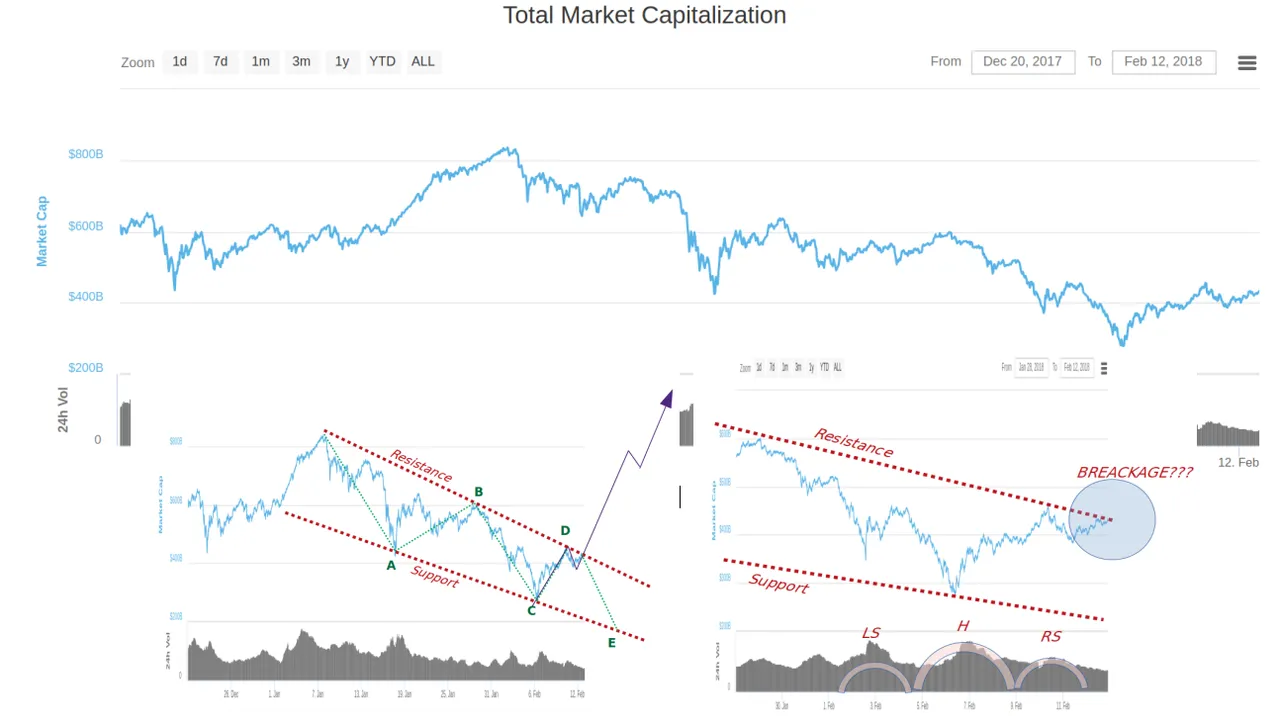
Seems that the "Monster" is fighting against the upper resistance and if he manage to break it, should we consider it as the end of the correction? My bet is that YES!
But also, because I think he is also manifesting his power by drawing a sort of Inverted Head and Shoulders Pattern on which we may identify the 3 increases of volume perhaps validating it:
As I said, pure "Especulative Masturbations" but...
...have ever told you that I am a "dreamer" already?
Enjoy Cryptoland!!!!