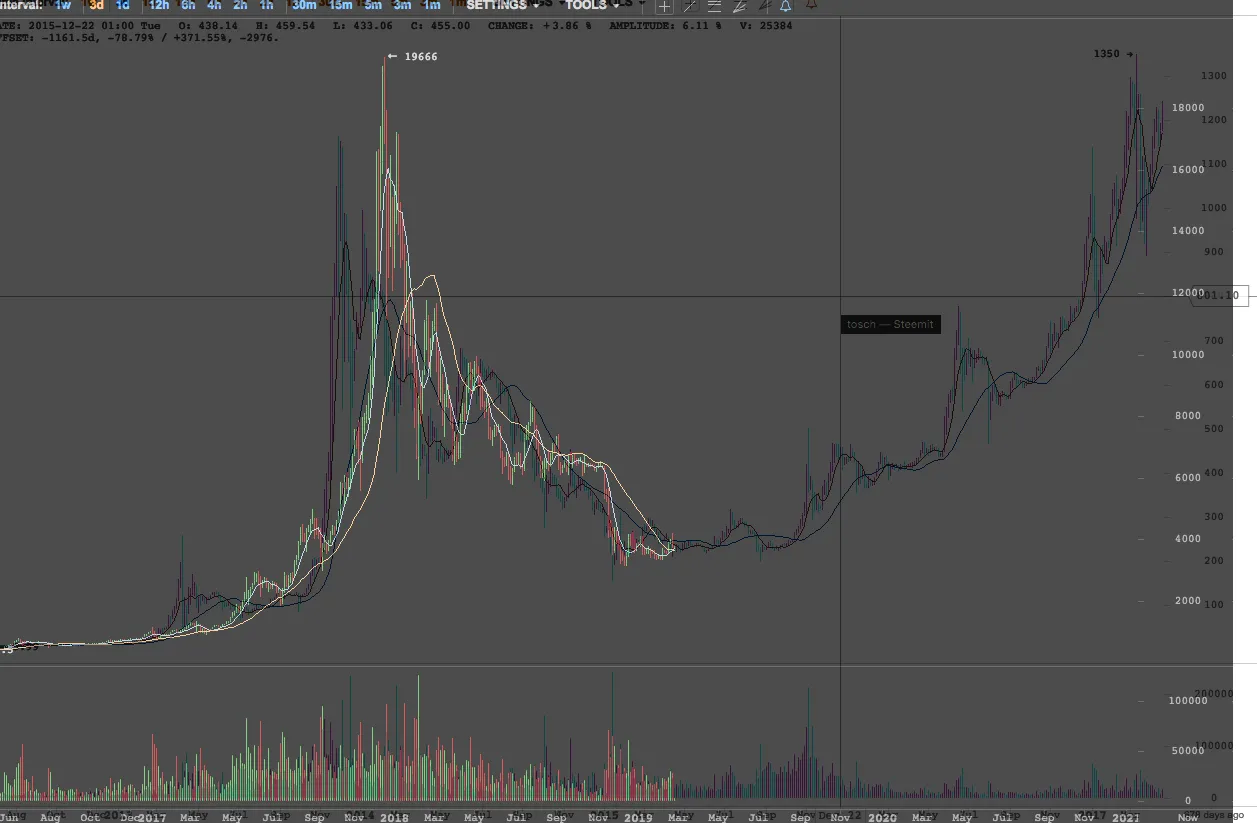
The Bitcoin bubble popped - once again - in 2018. The similarities to what happened in 2014 and following cannot be denied. Every once in a while I am looking at charts provided by Bitcoinwisdom, my goto site for live Bitcoin prices.
Just for fun (no financial advice or future forecast) I have put the two bubble bursts ontop of each other to compare them.
The back layer in white represents 2013-2015, the front layer in black represents 2017-2019. Similarities are astonishing.
And even further, this typical bubble behaviour is not unknown in the world of new technologies. It has even be predicted and studied. Especially in an emotional market like Bitcoin the Hype-Cicle cannot be ignored.
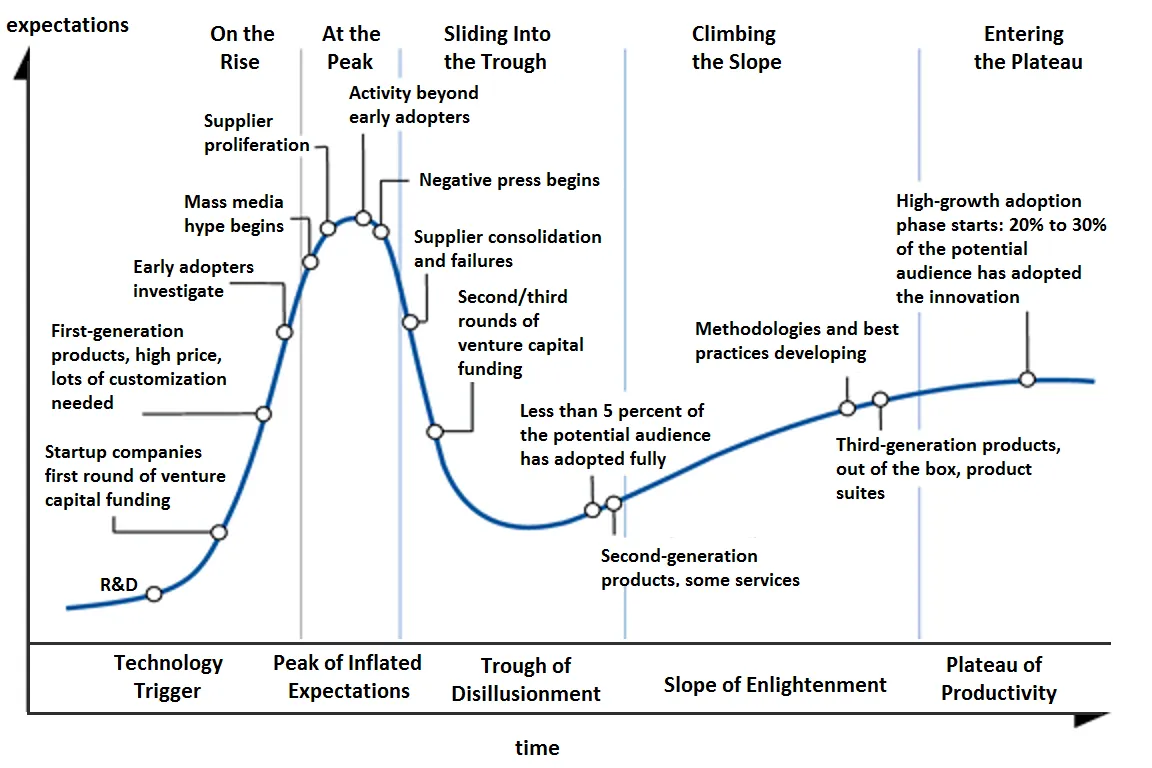
(CC BY-SA 3.0 Wikipedia)
I guess most of you did point that out for themselves and trying to figure out where the adventure goes from here. I hope you enjoy this still. Share if you want others to see this and give an upvote if you enjoy this.