Summary:
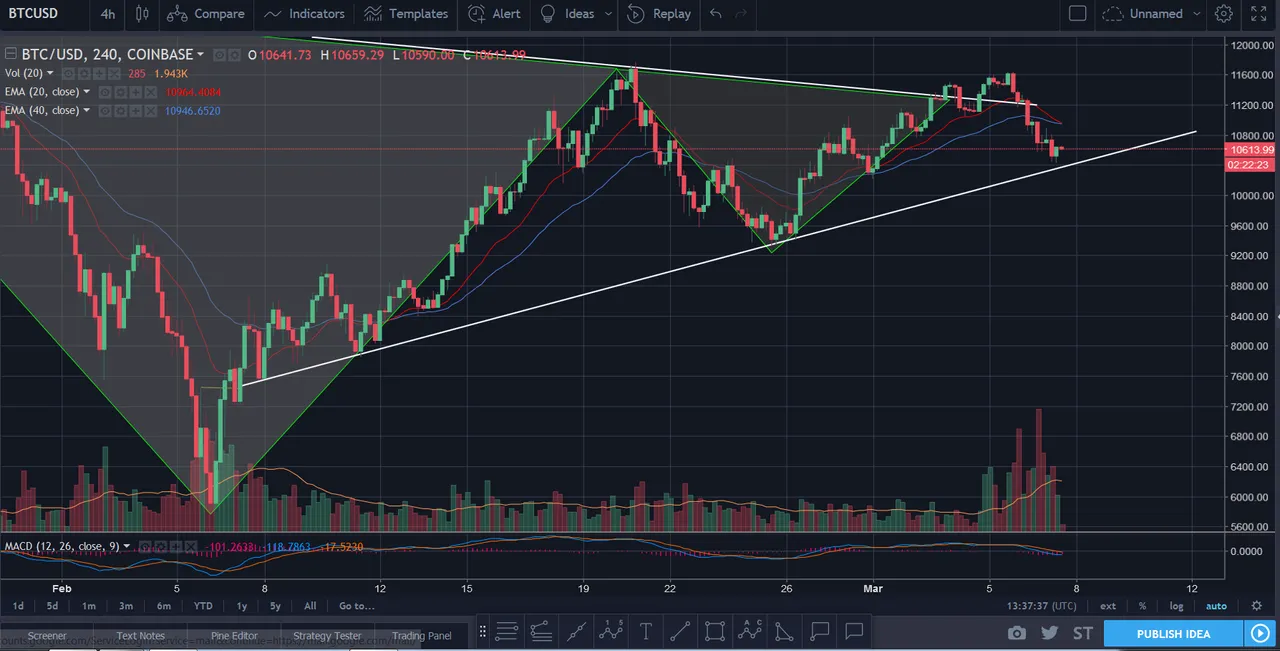
Bitcoin price action is showing some interesting mirror image. The Head & Shoulder pattern with 19k highs did not break the neckline of the first attempt instead it retraced all the way back to full swing 61% and came down to break he neckline and took couple of month to reach the 5900 lows.
The current inverted H&S pattern, the neckline has not been breached on the first attempt, which completes right shoulder formation and price has been making a retracement back. If this we apply the same fractal logic to this pattern we might see a lower retracement which could come as deep as the low of the right shoulder before price heads up.
What makes this analysis more interesting it the both the pattern share COMMON NECKLINE. Neckline for both h&s pattern is the same trend line support/resistance.

All this might come into play if the price break the support trend lineand make lower lows. MACD still has roam to go lower.
If you like this post please upvote, follow and Resteem this post, You can also follow me on twitter to get instant updates @tradewithtechie
Disclaimer:
I am not a financial advisor, nor the information posted in this article is a financial advice. The information in this article is my personal opinion and is not recommended to make any investment transactions based on it. I do not take any responsibility for the investments made based on my analysis.
