Summary:
Bitcoin price has been making higher highs for the last couple of day, But it has not broken the downward trend channel i posted in my previous post. Support zone at 8400 level is holding for now and MACD is giving a bullish indication at these levels. This looks to be very key level and if the price breaks this channel we can confirm the trend reversal.
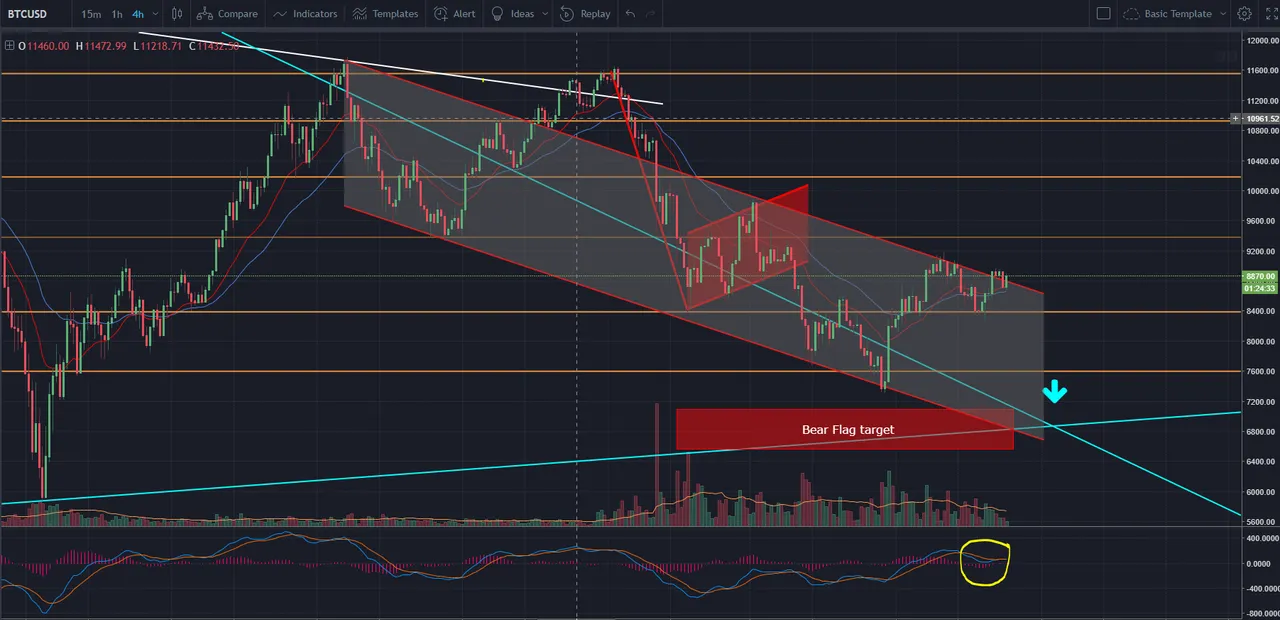
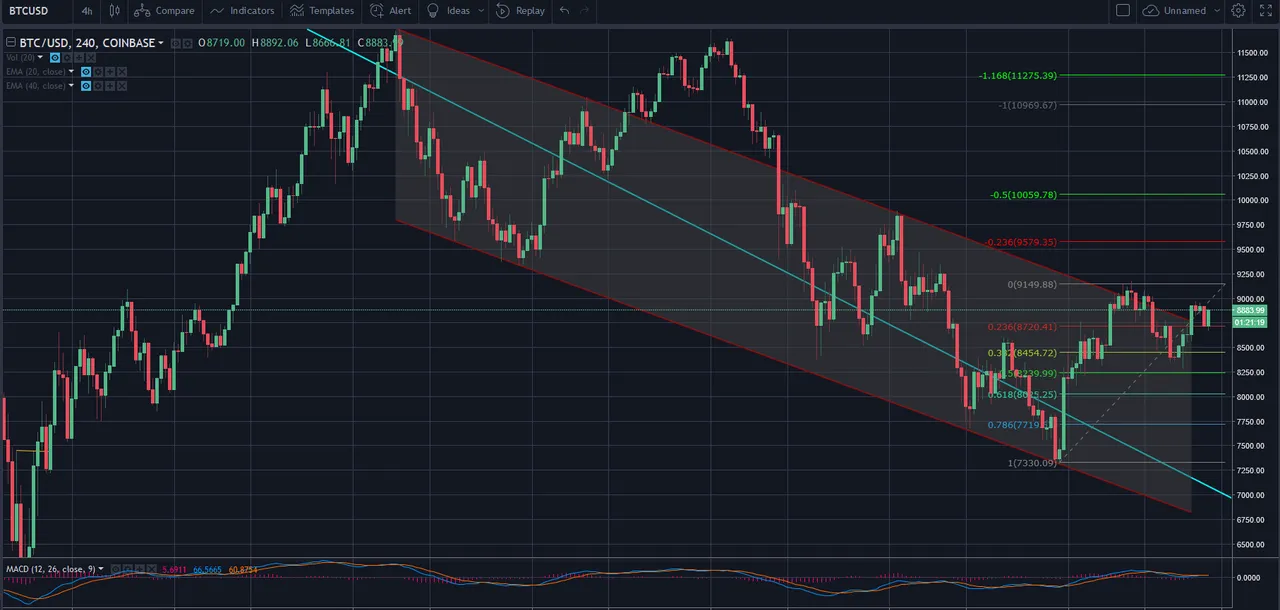
The Bear flag pattern might fail to hit its target if the channel is broken because price is bouncing off of the 50% fib zone which is lining up with the previous confirmed support level.
LongTerm Pattern on Daily Chart:
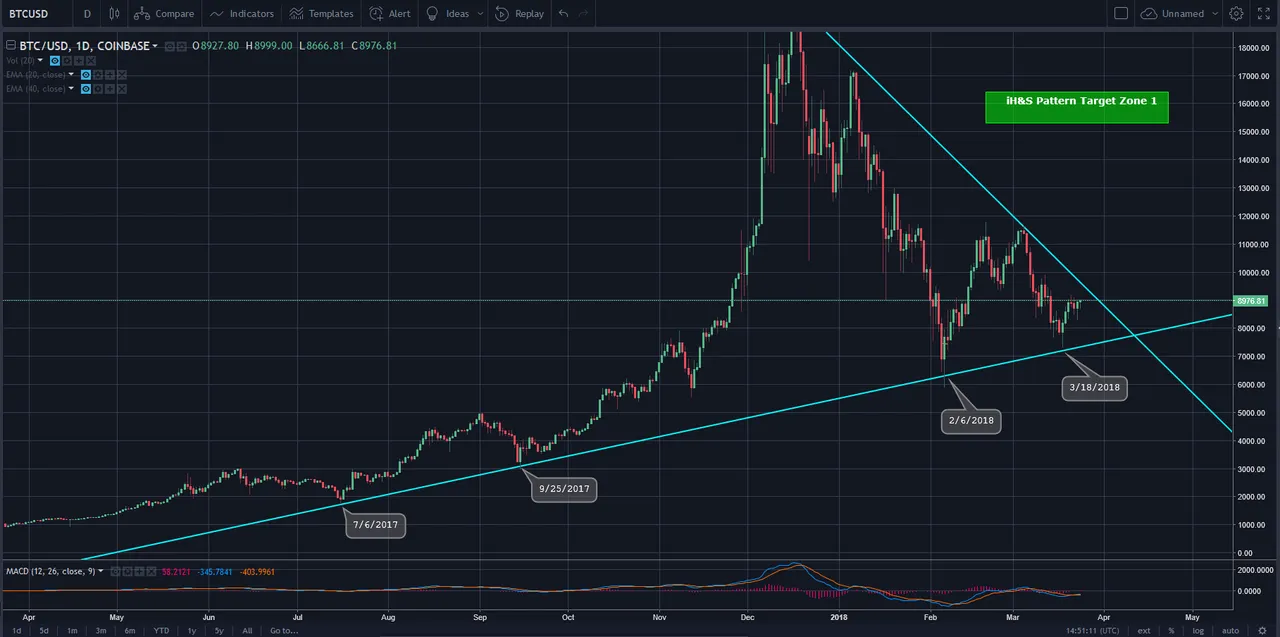
Bitcoin price action since the 19k highs looks to be forming a HUGE inverted H&S pattern with the resistance trendline as the neckline which gives us targets of 15k and 22k zones upside.
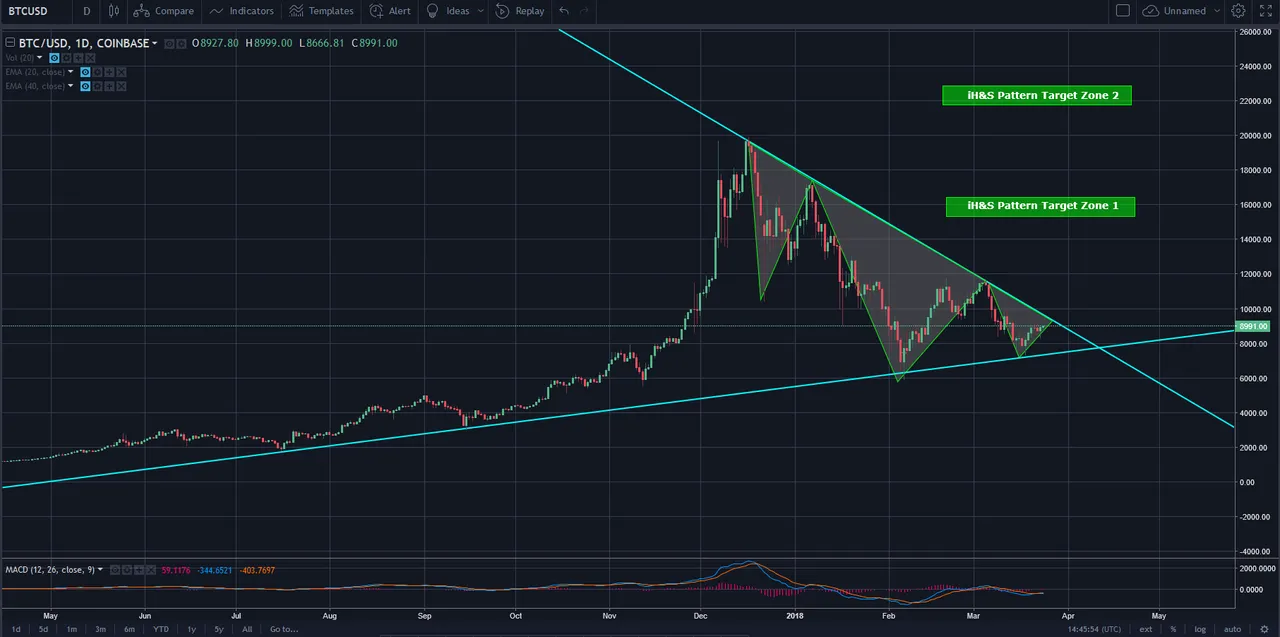
Also if i adjust the multiple year support trend line a little to cutoff the bullwicks, the recent swing looks to be bouncing off of it with confirmed support.
I would feel more confident to look for upside target than to the downside, if the downward channel is broken soon.
If you like my analysis please upvote, follow and Resteem this post, You can also follow me on twitter to get instant updates @tradewithtechie
Disclaimer:
I am not a financial advisor, nor the information posted in this article is a financial advice. The information in this article is my personal opinion and is not recommended to make any investment transactions based on it. I do not take any responsibility for the investments made based on my analysis.
