
My Analysis On The Past 8 Months.
As I observe the movements of the past 8 months I start to see a bit of a pattern and trend....
...price drops...
...then goes up 50% (roughly)...
...price drops...
...then goes up 50% again.
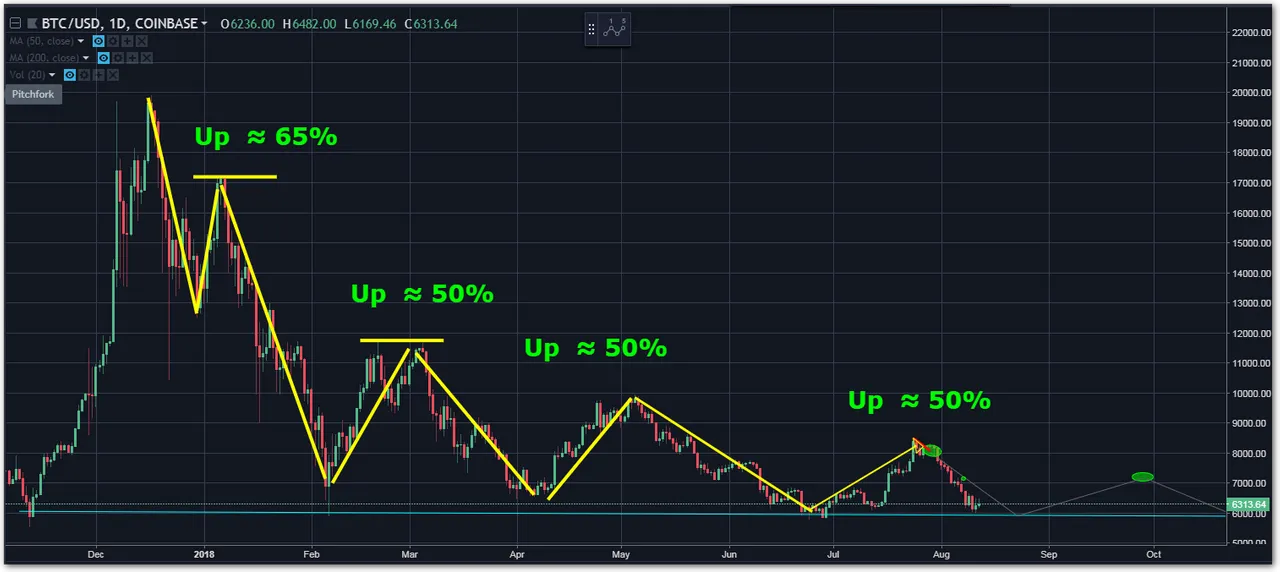
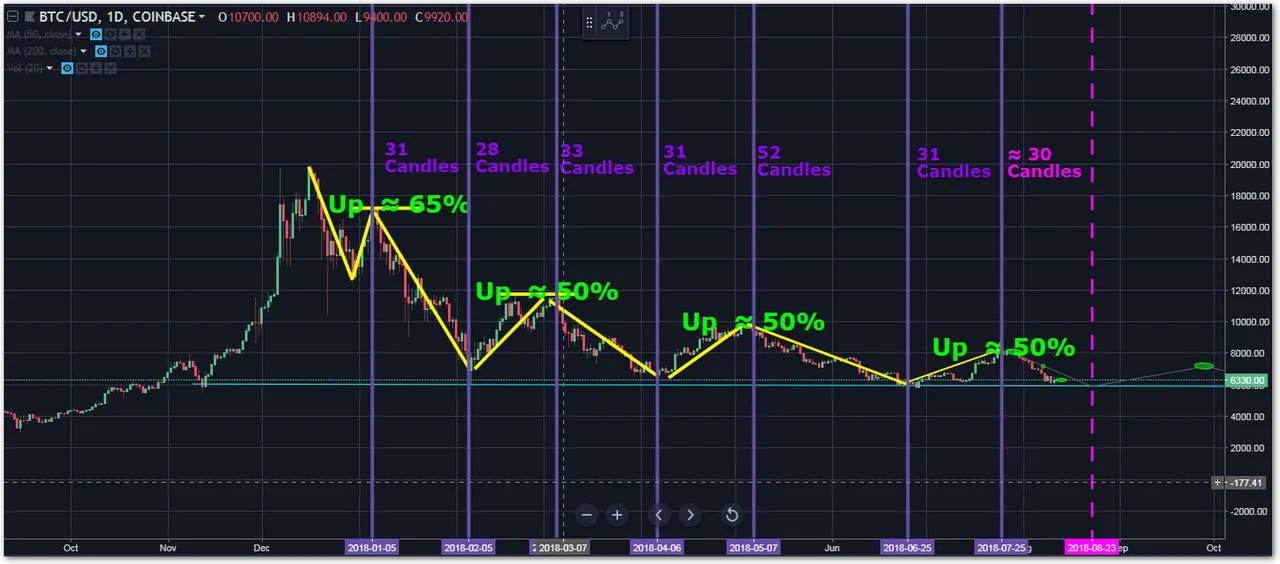
I also noticed that these swings happen "roughly" every 30 days or so.
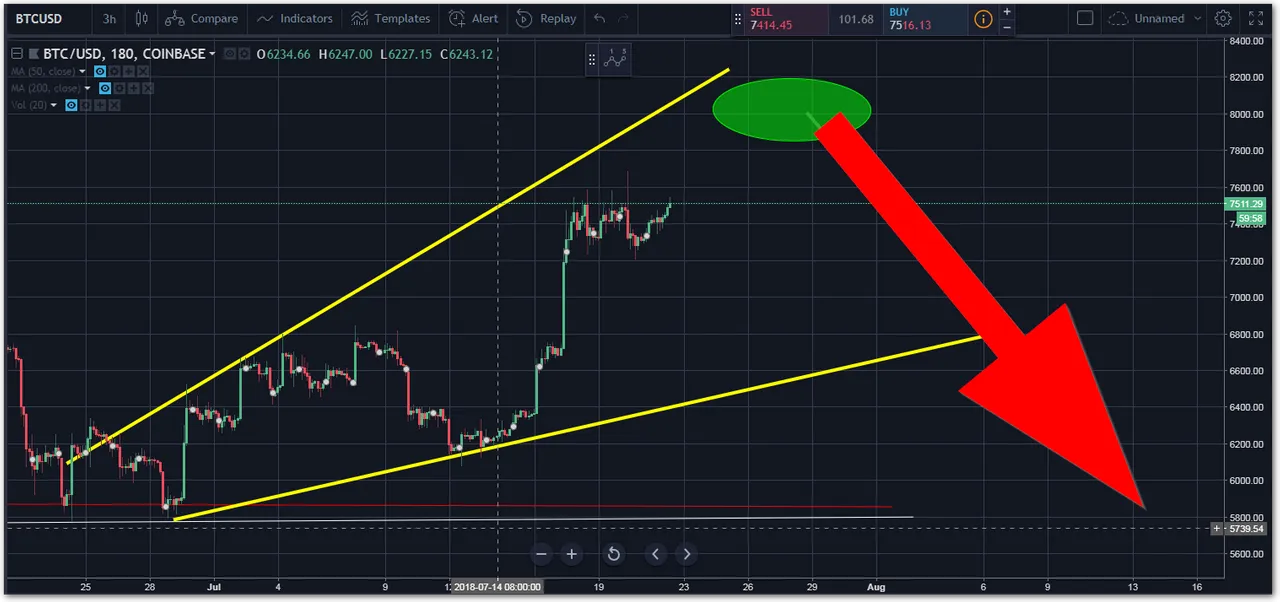
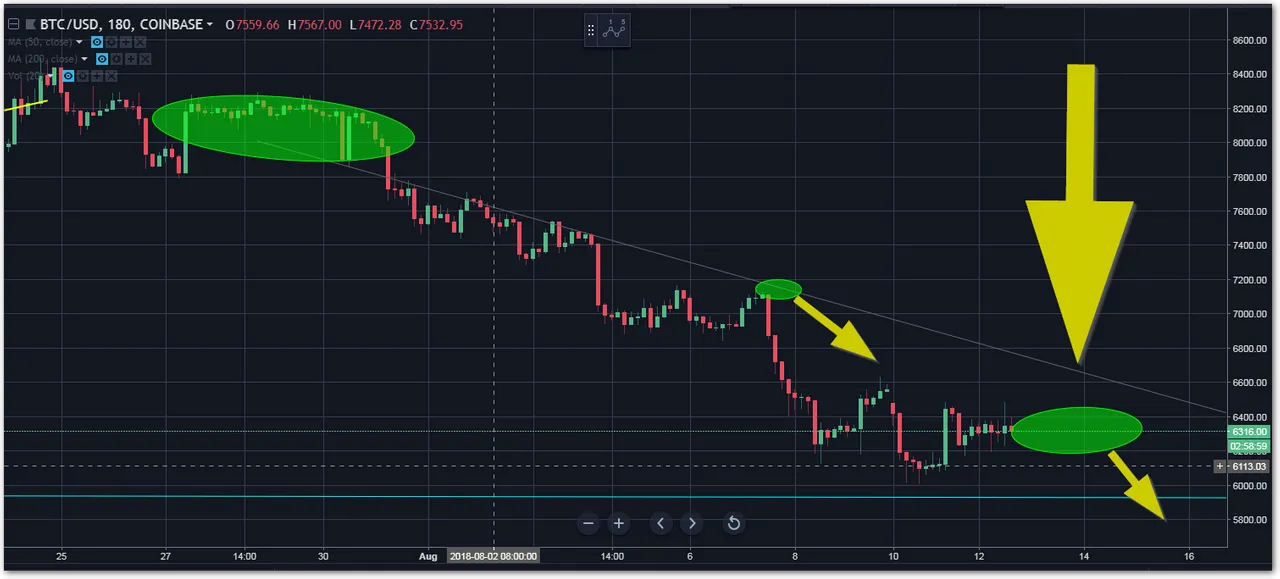
Using this pattern I figured, if true, it should drop somewhere in this green circle
It Worked!!!
Sure enough (or I got lucky), it reached to the mark close enough, roughly 30 days and 50% up and then it dropped like a rock.
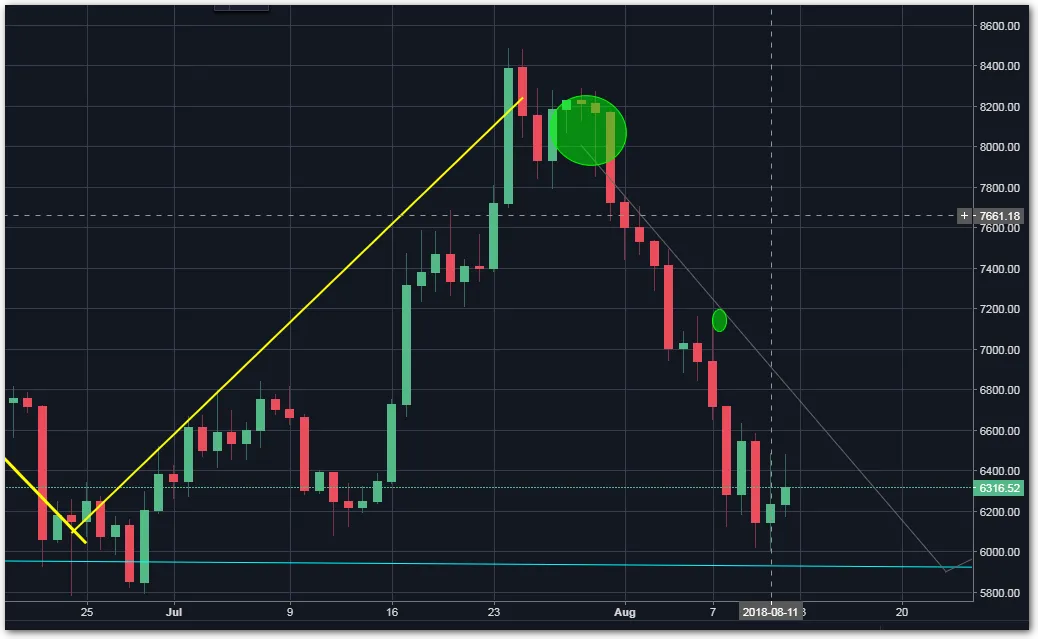
Now I can Draw a trend line to where I expect it to be in 30 days (8/22/18), but also assuming the price goes back to ≈ $5800.
This helped me in drawing new green circles where I expect the next quick dip before reaching the 30-day mark and $5800.

Will this happen? Maybe...but it really seems likely.

My Thoughts...
- I see predictability, to a degree.
- I see a rather solid support line (+/- 300).
- I see new opportunities to jump back into the market!
- I see where this "wedge" may be squeezed too tight. I don't know 100% that BTC will break $50k by end of the year but I do this it will happen within Jan -- April of 2019.
As I see it, Bitcoin (BTC) is not dead and this year is like the "Black Friday" of crypto specials. As for myself, I'm going to wait until it reaches closer to the 30-day candlestick (8/22/18) and then I'll buy a LOT of #STEEM and #EOS.
Legal Crap
The above references an opinion and is for information purposes only. It is not intended to be investment advice. Seek a duly licensed professional for investment advice.
Sources:
- All images used were of my own creation
