While renowned bitcoin investors Tom Lee and Mike Novogratz have called the bottom for bitcoin, the charts I'm looking at still have some room to the downside left.
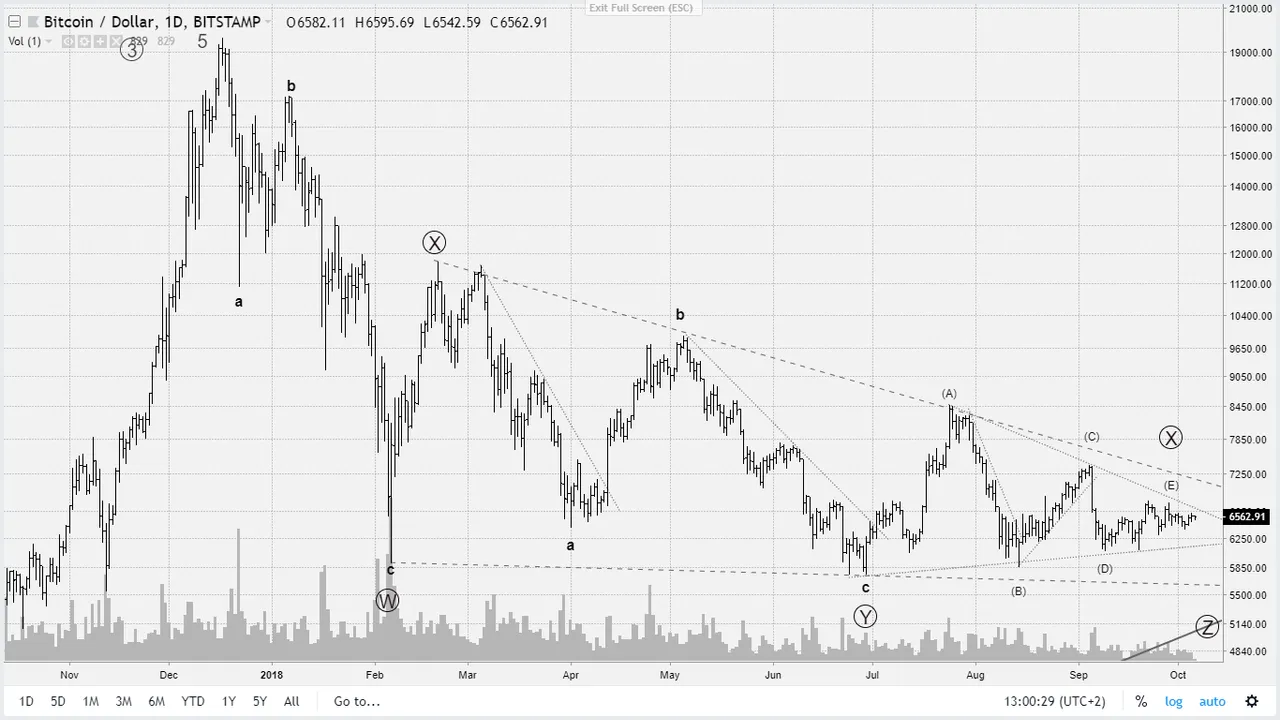
An exciting new count has surfaced to establish that. In this variation the move from December is one big zigzag with wave A in February and wave B in March. From there an ending diagonal starts that should end somewhere this October.
Now an ending diagonal is an interesting pattern. It is a five wave move, but it subdivides into three waves, not 5 wave impulses. On top of that, waves 1 and 4 overlap. This clearly indicates a loss of momentum, a loss of strength, a display of exhaustion and ending diagonals can consequently be seen at the end of a long term move completing either a larger wave 5 or, as in this case, a zigzag correction pattern.
Still, in an ending diagonal, wave 3 cannot be the shortest wave, which it currently is, therewith prohibiting wave 5 to go down hard and surpassing wave 3. The downsloaping support trendline gives a rather perfect target of approximately 5650$.
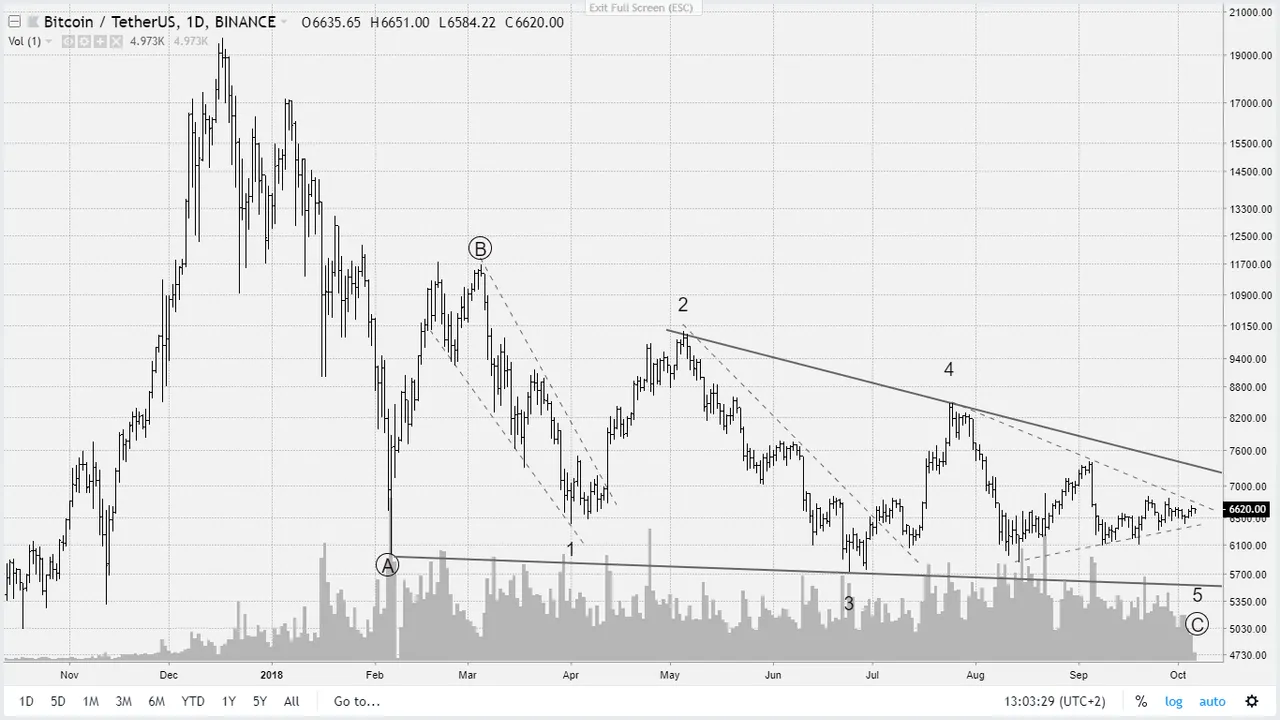
The more I look at this ending diagonal count, the better I like it. Especially as the alternative counts (one of them displayed below) should have consequences that are a lot more bearish, including even a breach of the long term uptrend, which I simply don't believe. My crypto antenna does not pickup any sentiment indicators that would justify such bearishness. Also, I find it totally unbelievable that the altcoins will either have another massive drop in unison with bitcoin, or will stay flat - perhaps even move contrary to bitcoin - either which scenario would unravel with even more depressed bitcoin prices.
The crypto correction feels like nearing the end. The ending diagonal count justifies it best.