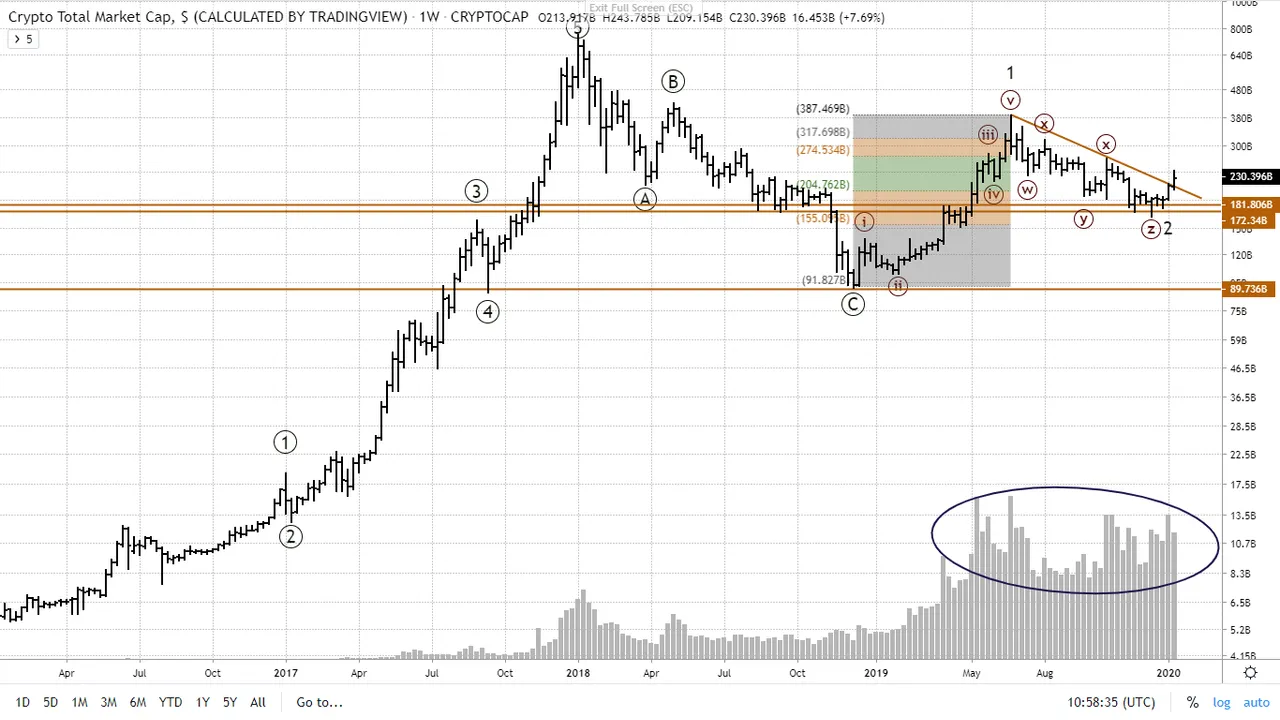
Above a chart of the total crypto market.
We've found support on an important level in November and December and have now broken through the down sloping trend line from these lows in impulsive fashion.
Don't forget to look at the volume, which has been pretty spectacular for almost a year now. This is a good and convincing breakout!
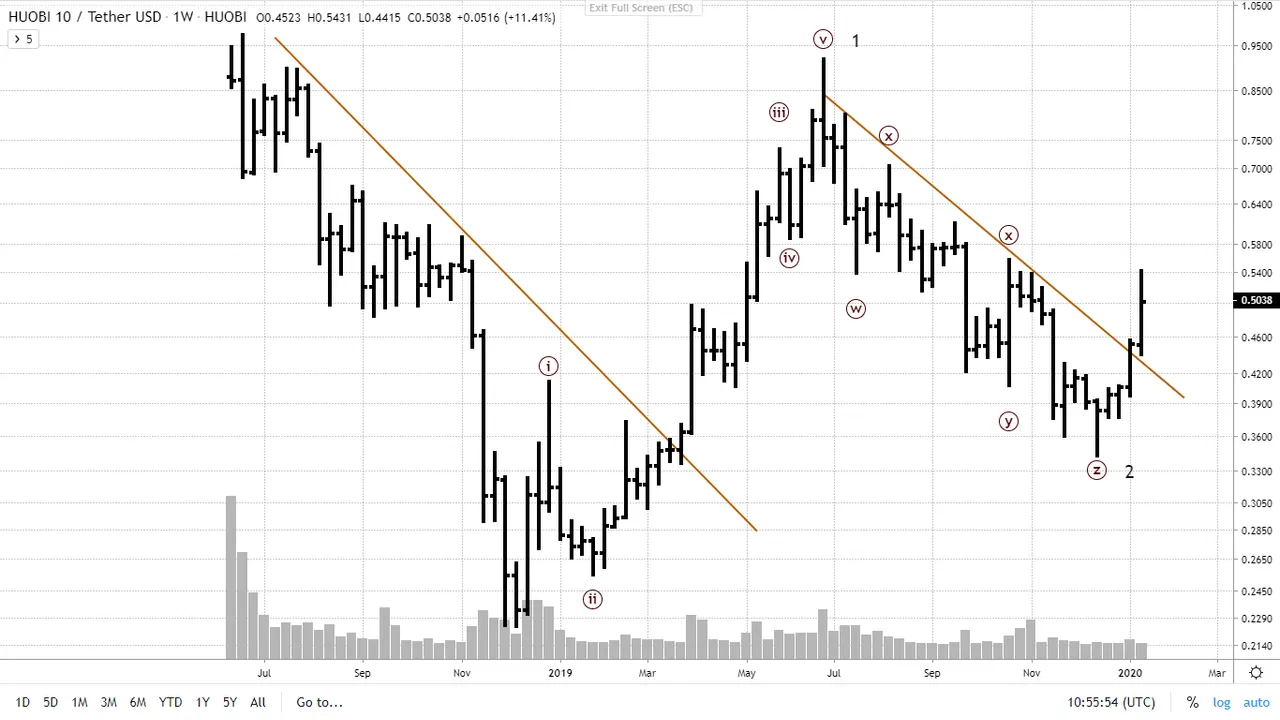
This breakout is confirmed by the Huobi10, for which we would like to see some more volume, although we have three days left.
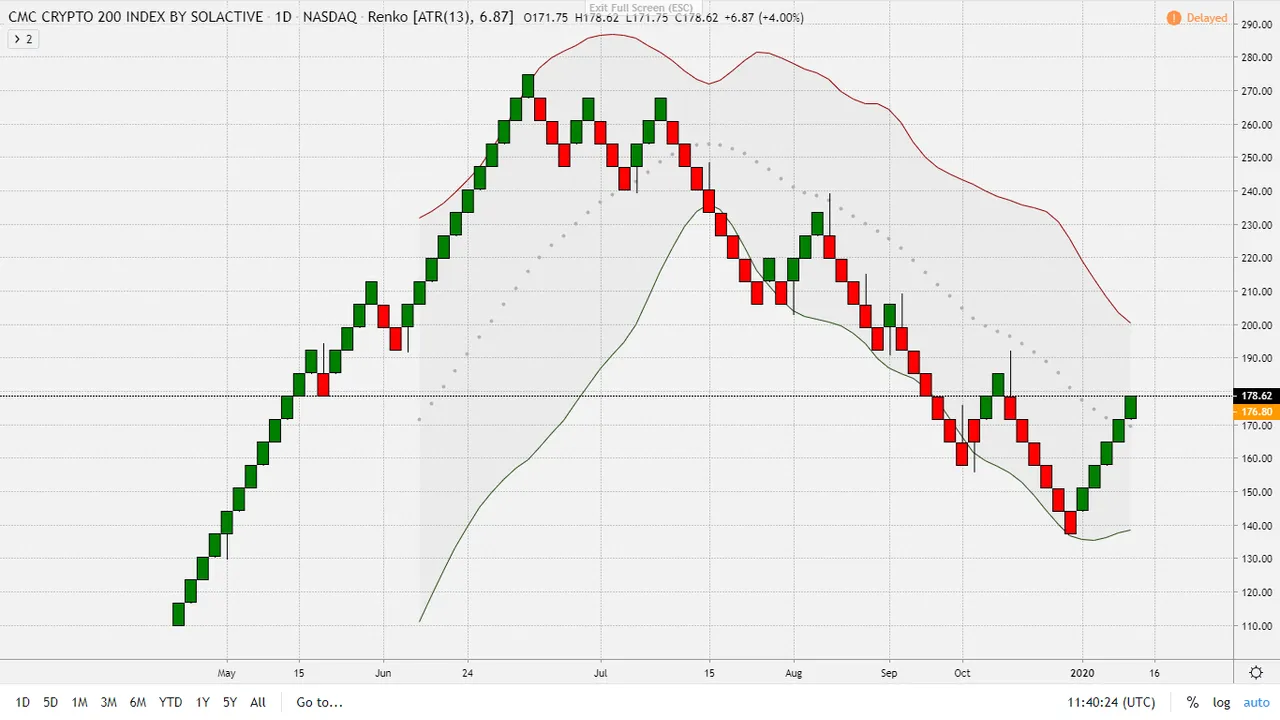
Coinmarketcap has launched its own index on the Nasdaq, Bloomberg and a Suttgart exchange: the CMC200, which is obviously improving too.
Bitcoin itself is less clear.
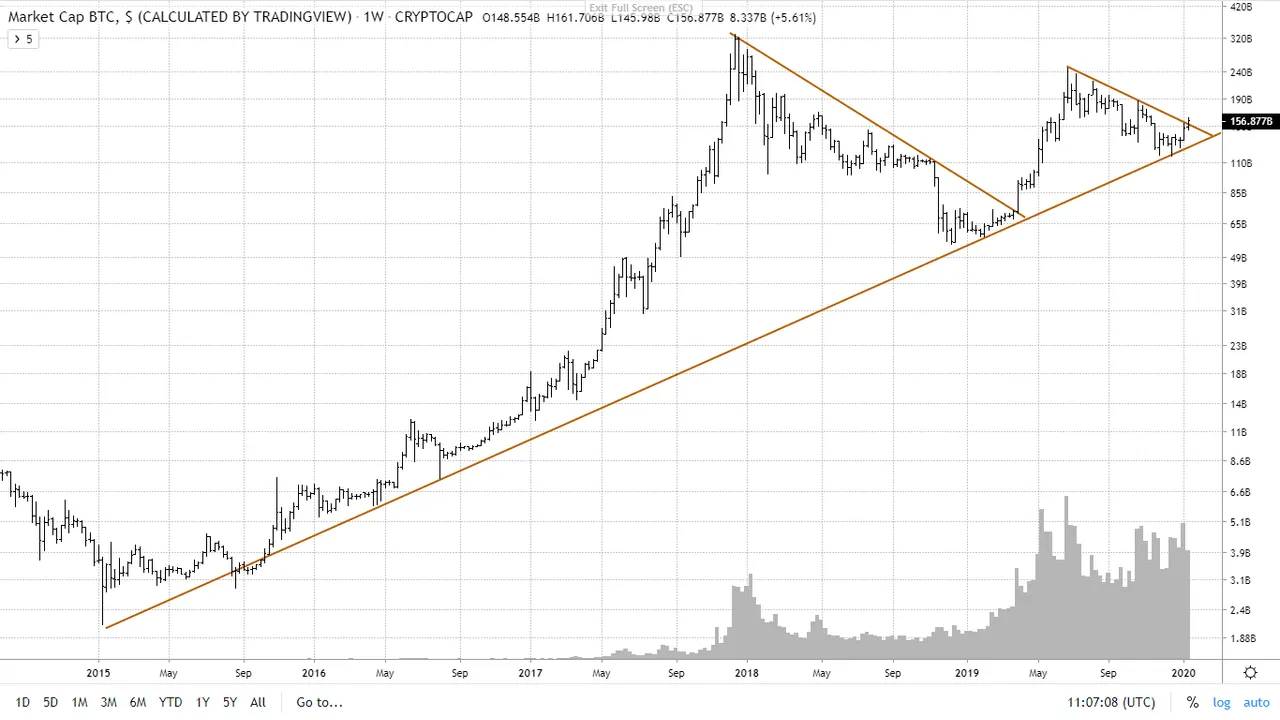
The BTC total market cap (amount of bitcoin x price) is breaking out with a significant rise in volume. Beautiful long term weekly support line by the way.
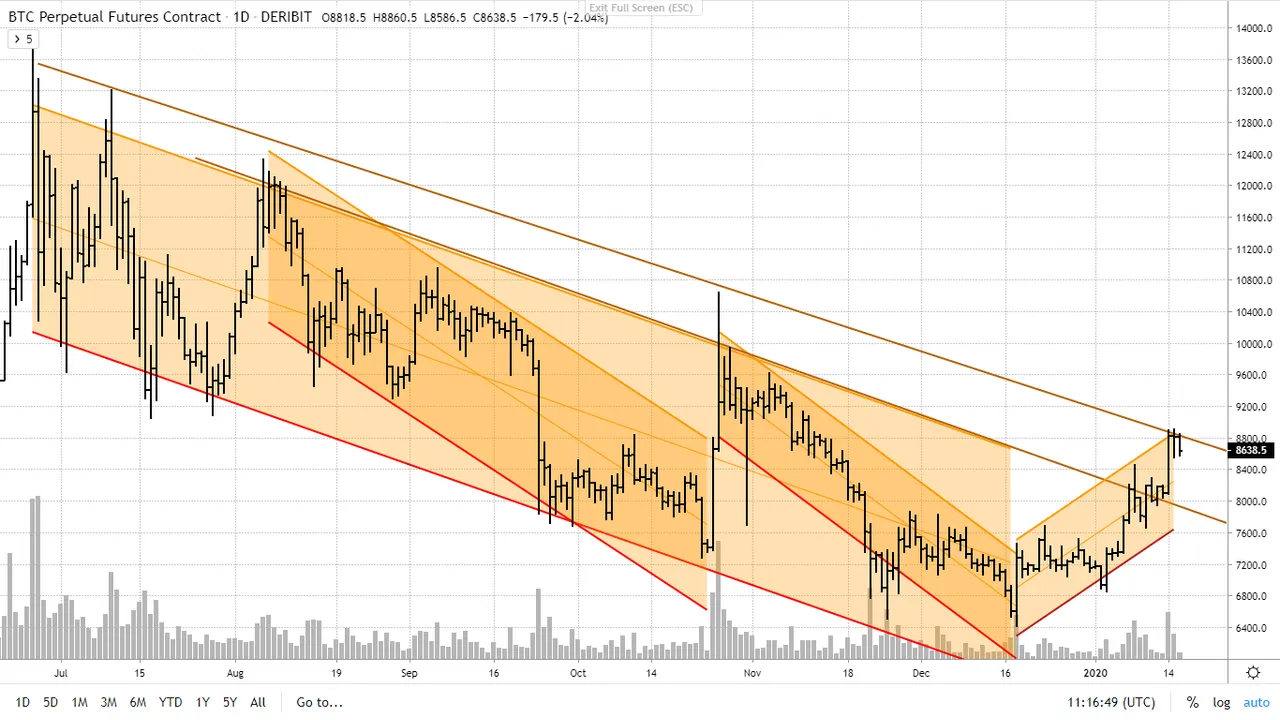
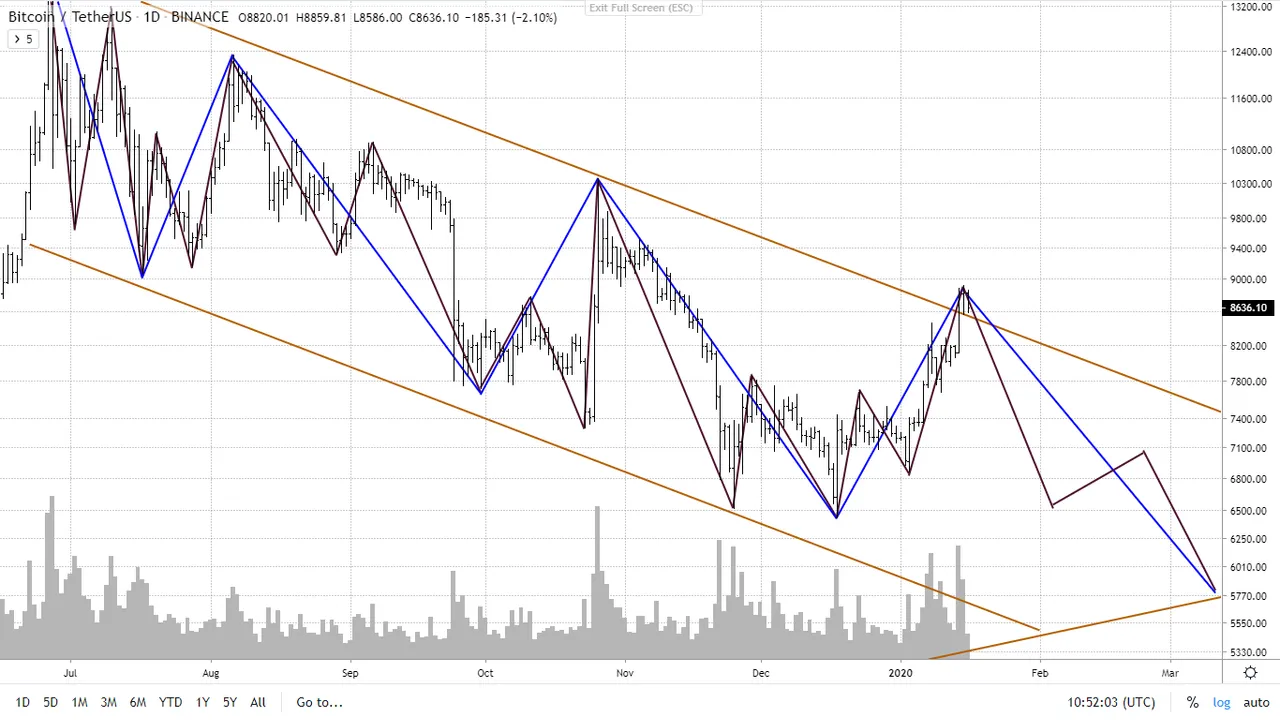
But, if you look at a regression channel on a non-log style chart, it's not so clear any more and we might just as well drop to new lows as below.
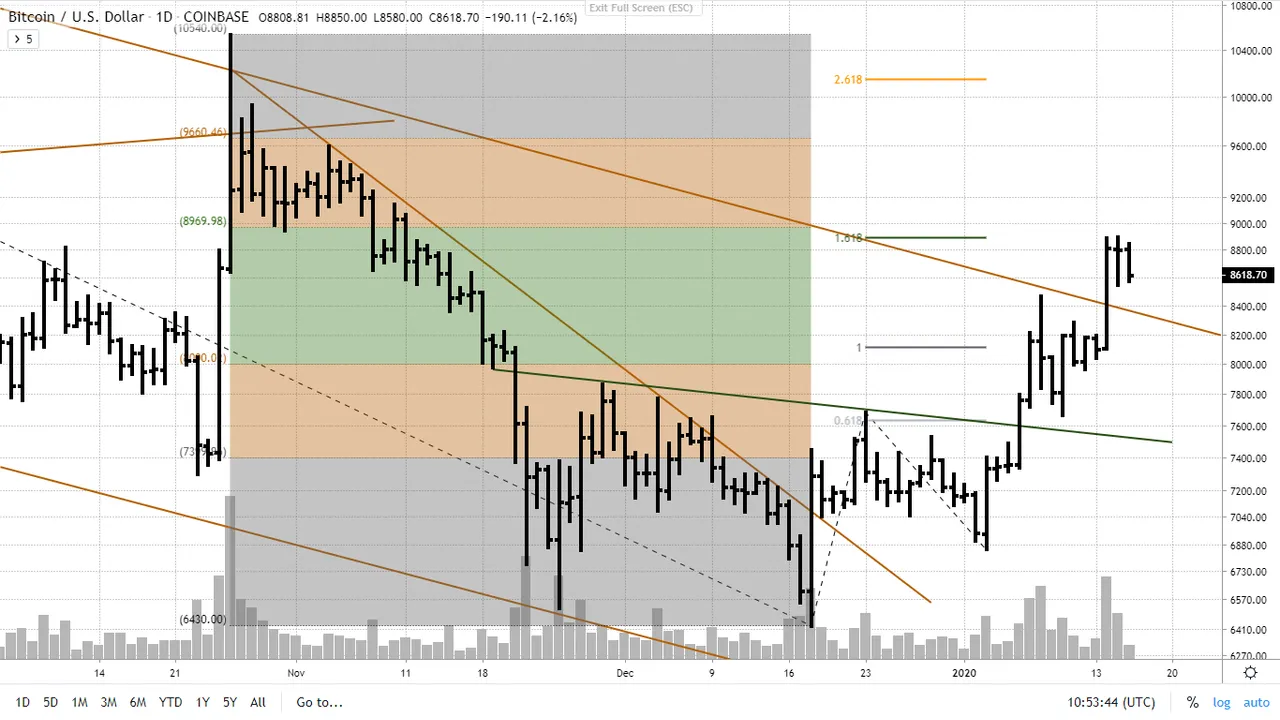
This is supported by the fact that wave 3 was exactly 1.618 times wave 1, which stopped at exactly the 61.8% retracement level from the October to December move down.
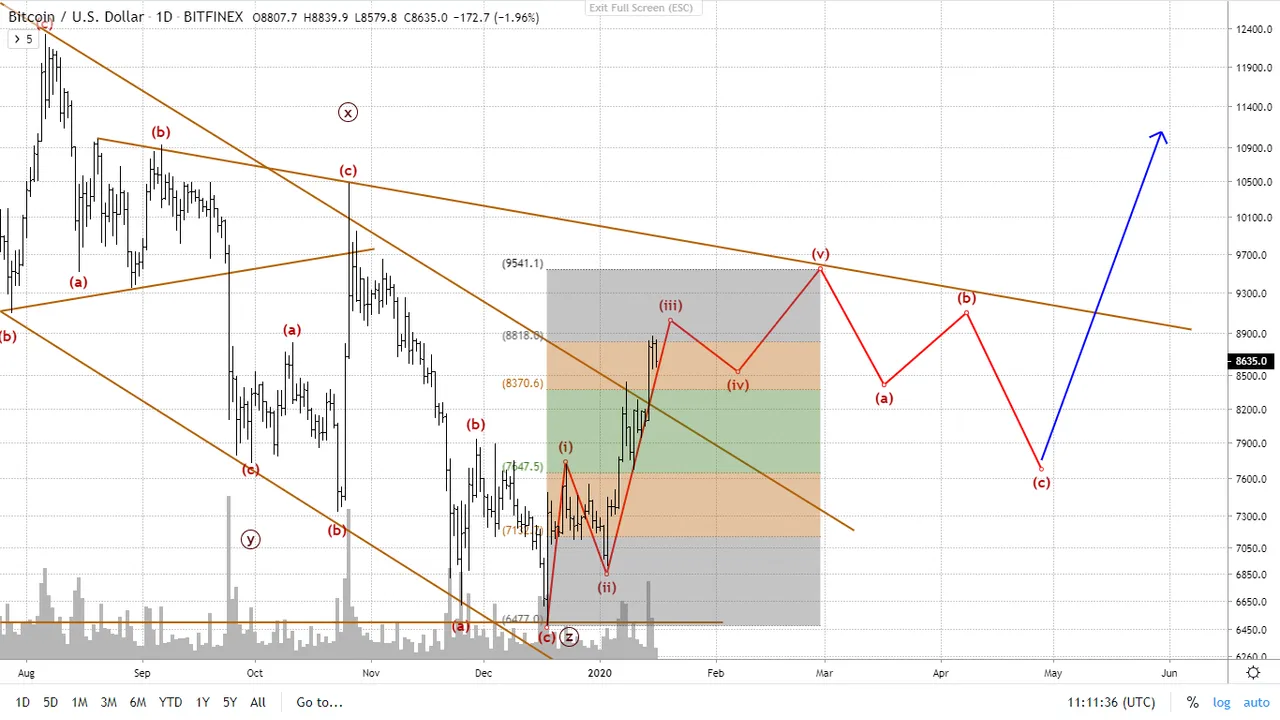
But I don't believe the bearish scenario any more.
I am trying to sell my puts at 50% loss and I have increased my futures long position somewhat which I hopefully can increase more, if we can get a nice pull back. I'm hoping for the above scenario, which will give the indicators a change to retrace from overbought conditions: en passent creating a large H&S reversed pattern.
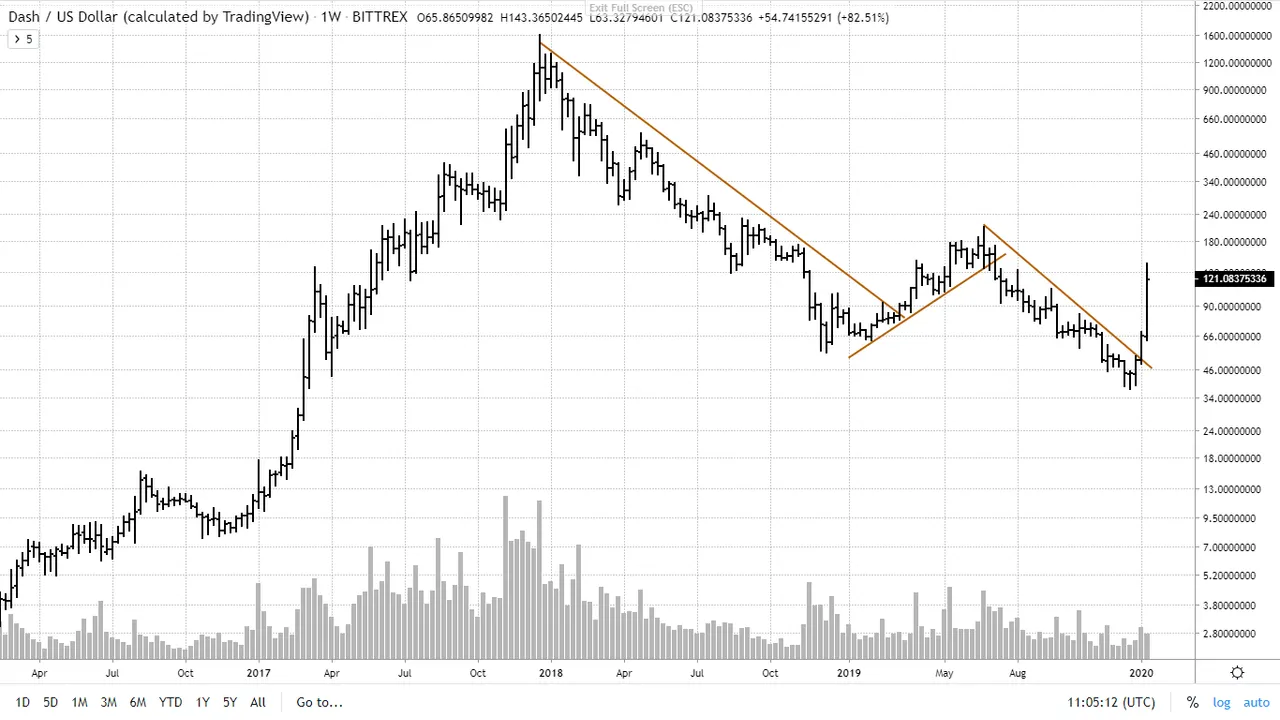
Dash is probably the star of this breakout, more than doubling in value in 2 days.
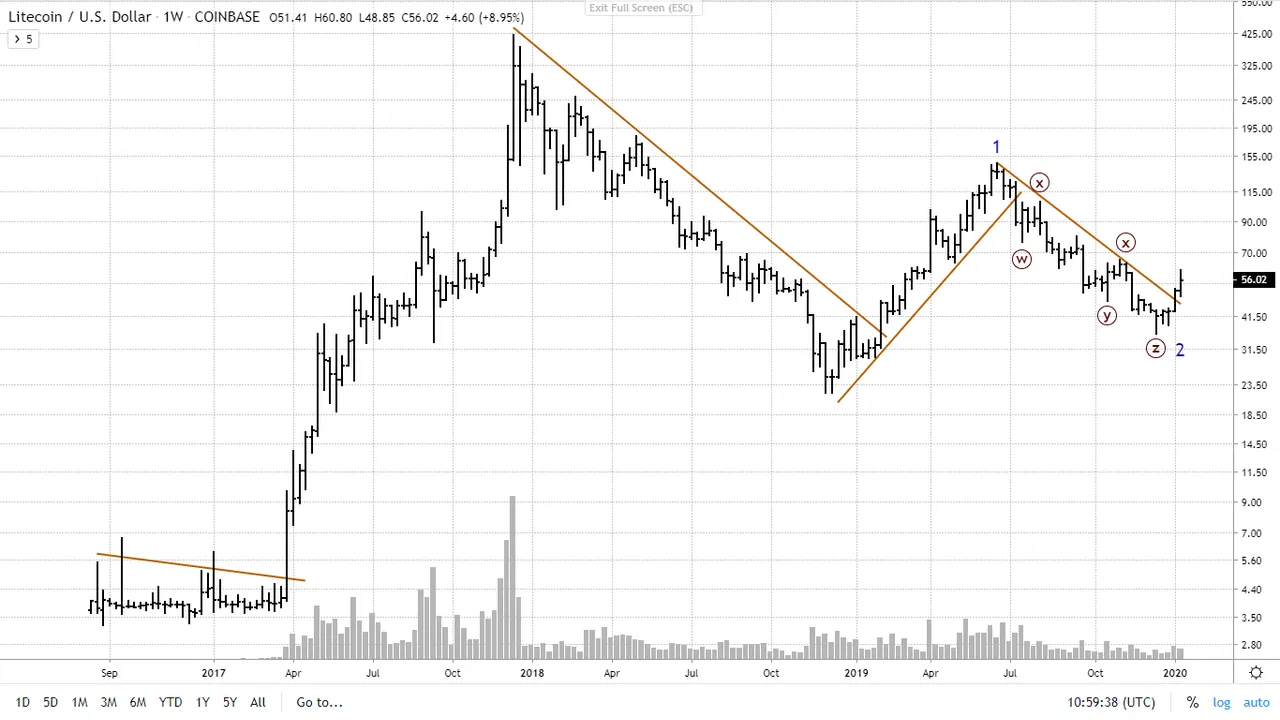
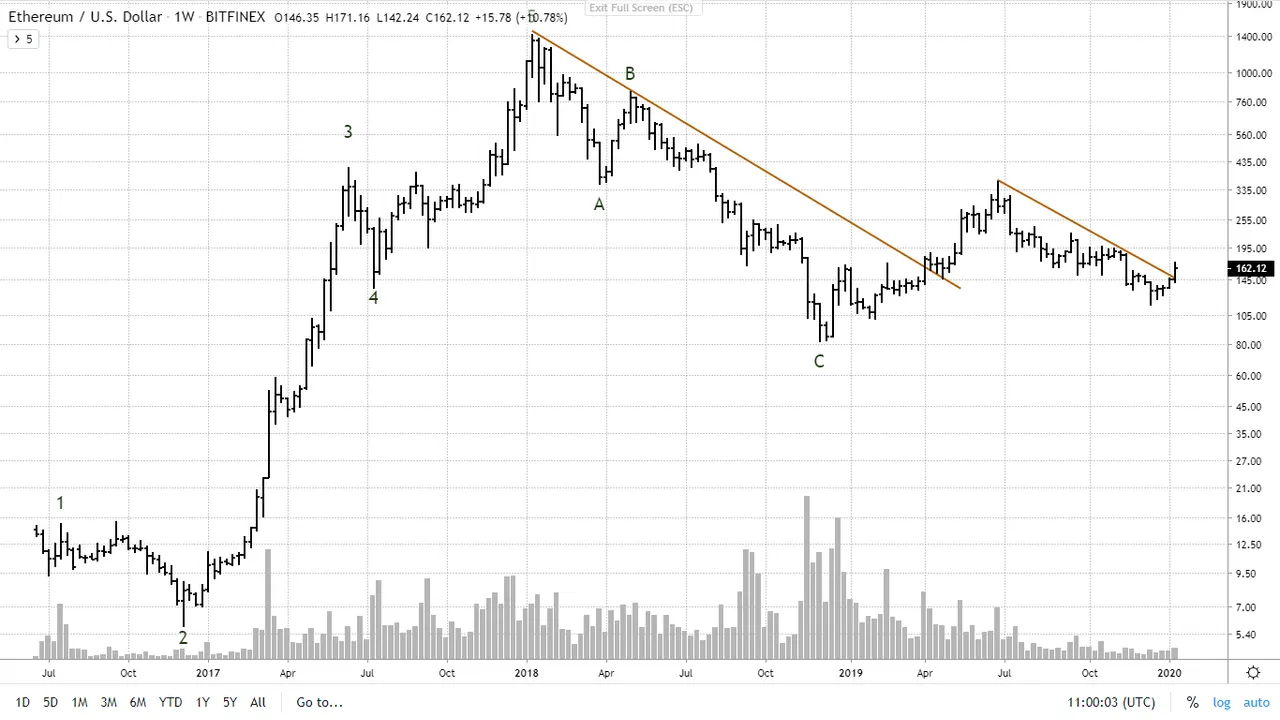
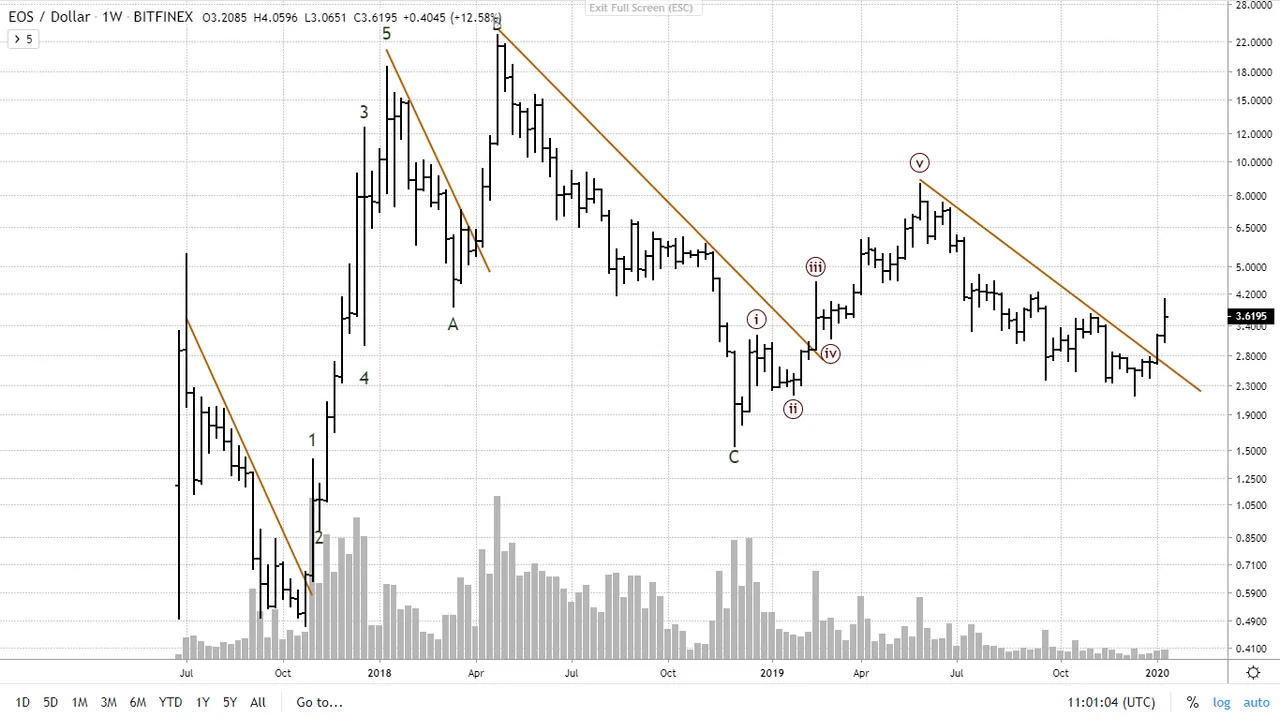
Litecoin, ethereum and EOS are also looking good, provided they add some volume in the coming days.