Hello friends,
I was just scrolling through Twitter, half mindlessly when I came across a chart. I generally always try to check out charts when they pop up, because there are so many insights to be cultivated. The graph is interesting because it shows bitcoin against its dominant trend line, and things look wild. Check this out.
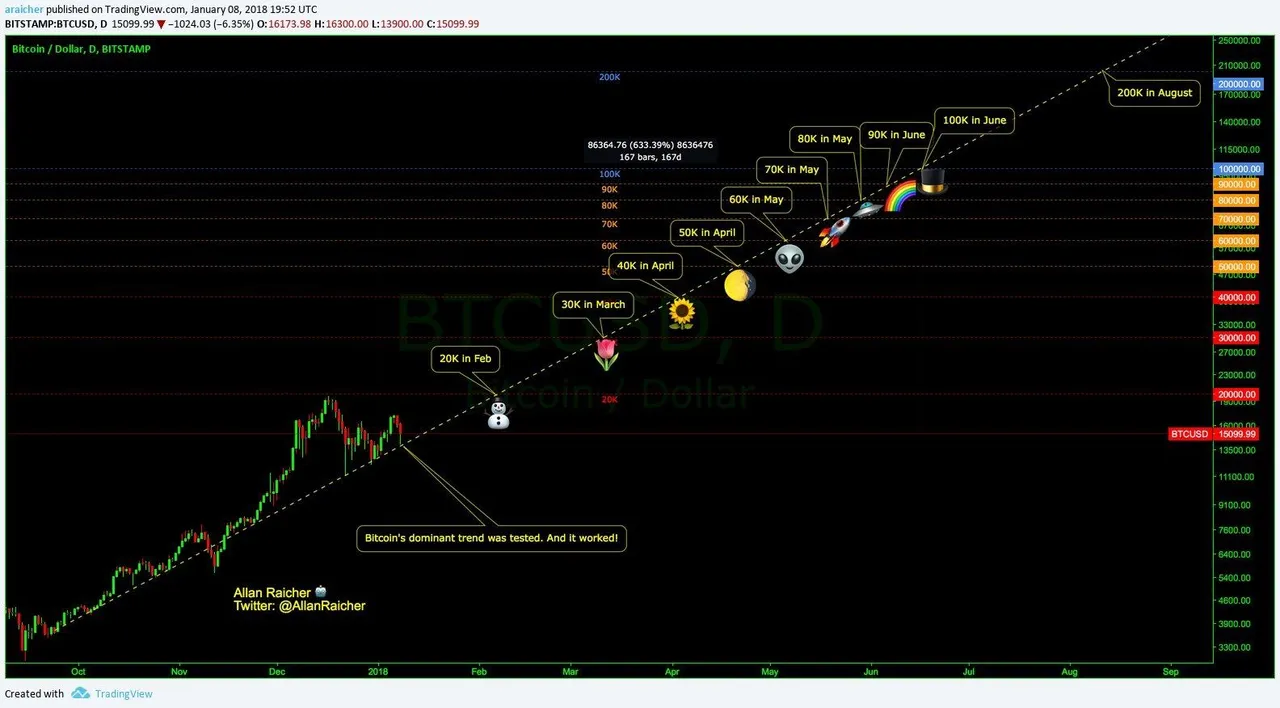
credit given on the photo.
For those who don’t get the idea here: this chart is showing the price of bitcoin testing low prices consistent with a trend line.
That trend line puts bitcoin at 100k in June! LOL
This is very possible, as long as the trend is maintained, but to maintain such a trend is going to grow increasingly difficult.
One of the most important factors I imagine will be dramatically increasing real world applications.
With this action, one would expect a reaction of more people finding bitcoin useful.
More useful = greater demand
Greater demand = 🚀 🌙well.. moon.
My point in sharing:
-it is fun to see bitcoin testing against this trend line, and where maintaining it will carry bitcoin
-help bring to light a key component in maintaining this trend
-express an interesting perspective on bitcoin growth
Please note that this is by no means investment advice. This is only bitcoin through a very specific lense. Please do your own research and invest at your own risk.
Thanks,
Zachariah :^)