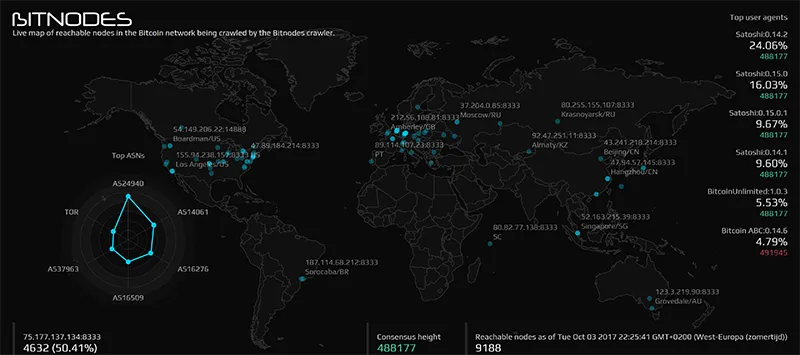
1. Live Visualization “Bitnodes” by Addy Yeow showing the distribution of Bitcoin nodes across the globe.
View bitnodes livemap
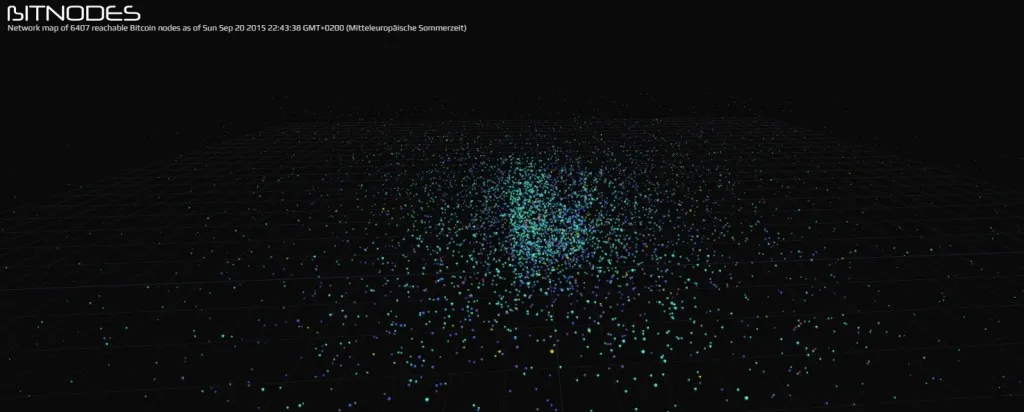
View the second bitnodes livemap by the same author showing the Bitcoin nodes and the node density.
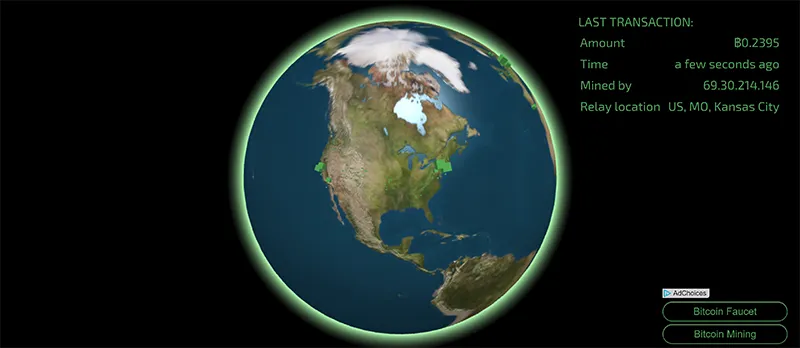
2. live-map by Wizbit displaying bitcoin transactions and the latest discovered Bitcoin blocks.
View live-map by Wizbit
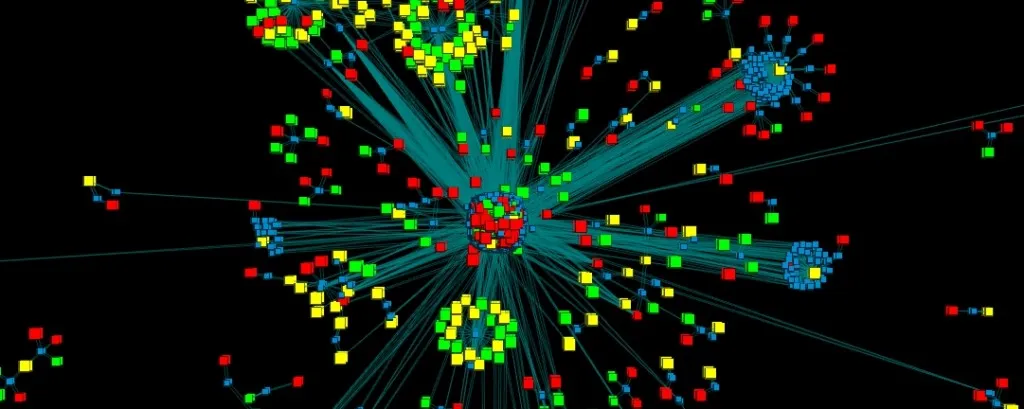
3. Open source vivagraph.js visualization, displaying Bitcoin transaction in real-time and the evolving hubs of the Bitcoin network.
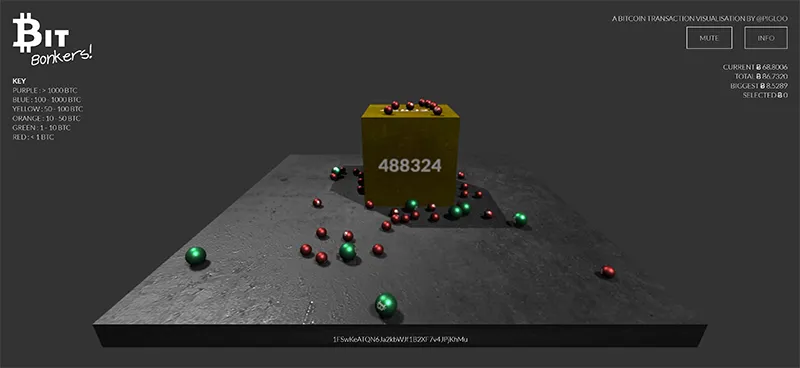
4. Owesome ''bitbonkers.com'' visualisation displaying live Bitcoin transactions from the Blockchain. A Bitcoin transaction is shown as coloured ball dropping on the plate.