
SUMMARY
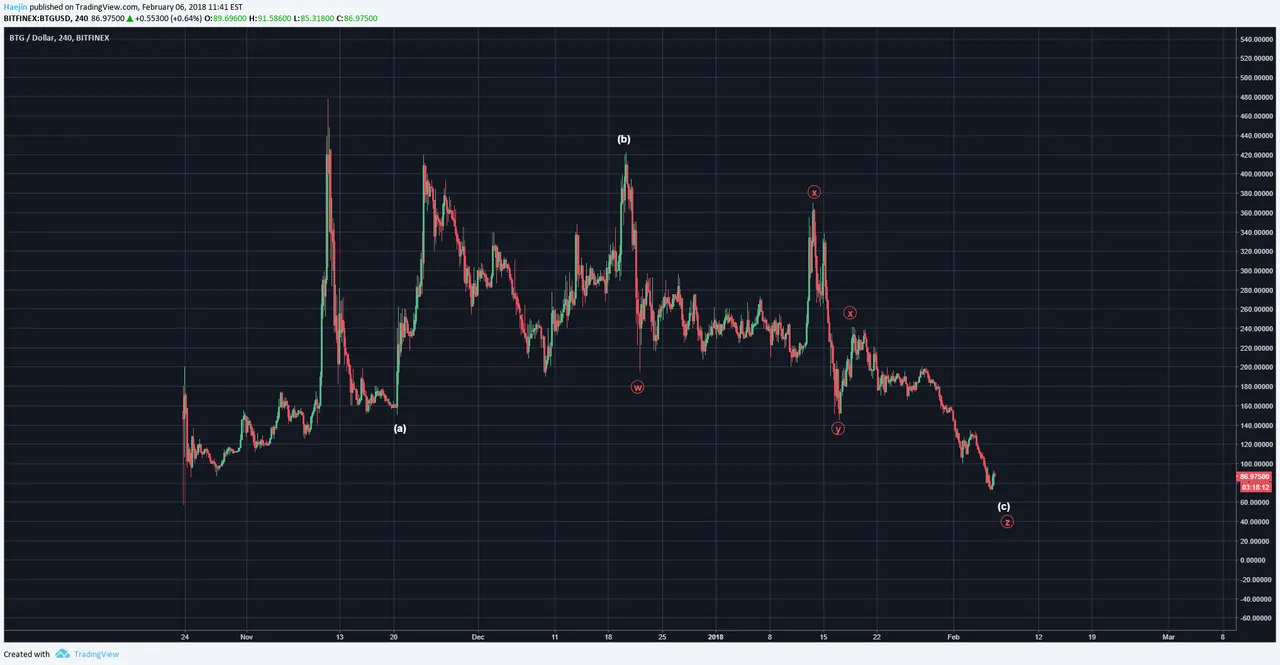
Bitcoin Gold (BTG) chart looks very similar to VERGE. It's a complex WXYXZ as shown below. The ABC outlines the overall correction and the WXYXZ are subwaves to the red C wave. The key question is where is the bottom to this correction? I don't know and non one knows when precisely this correction will finish. However, Elliott Waves and Chart Patterns can help to look for the indications.
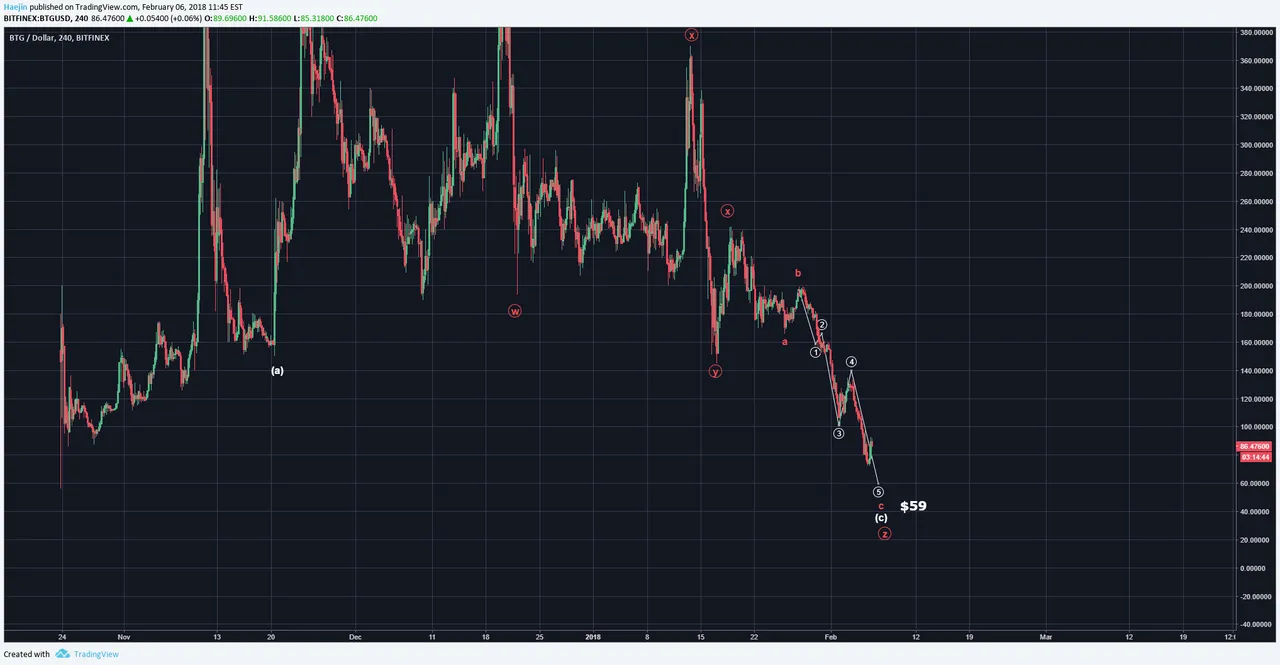
A closer look at the Z wave and its subwaves show that five waves for white C of Z could be near complete. If the below white five waves are correct, then waves 1,2,3,4 are placed with 5 remaining. This lower low could target $59 or so.
Legal Disclaimer: This is only my opinion, make of it what you wish. What does this mean? It means it's not advice nor recommendation to either buy or sell anything! It's only meant for use as informative or entertainment purposes.
Please consider reviewing these Tutorials on:
Elliott Wave Counting Tutorial #1
Elliott Wave Counting Tutorial #2
Elliott Wave Counting Tutorial #3
Laddering and Buy/Sell Setups.
Laddering Example with EOS
Tutorial on the use of Fibonacci & Elliott Waves
@haejin's Trading Nuggets
Essay: Is Technical Analysis a Quantum Event?
Follow me on Twitter for Real Time Alerts!!
Follow me on StockTwits for UpDates!!
--
--

If this blog post has entertained or helped you to profit, please follow, upvote, resteem and/or consider buying me a beer:
BTC Wallet - 1HMFpq4tC7a2acpjD45hCT4WqPNHXcqpof
ETH Wallet - 0x1Ab87962dD59BBfFe33819772C950F0B38554030
LTC Wallet - LecCNCzkt4vjVq2i3bgYiebmr9GbYo6FQf
