From time to time I used to do a sort of "Prospective" study on some cryptos which I am interested on.
This is a simple and easy analysis that gives you some good indications about potential projections of the price at mid and long term.
It combines the use of some trendlines and Elliot Wave counts to 1 day Candle chart.
This time I will analyse BITSHARES 1Day Chart, trying to have a time frame of more than 2 years.
I would prefer to take a Candle chart from Binance but for this time frame is impossible:
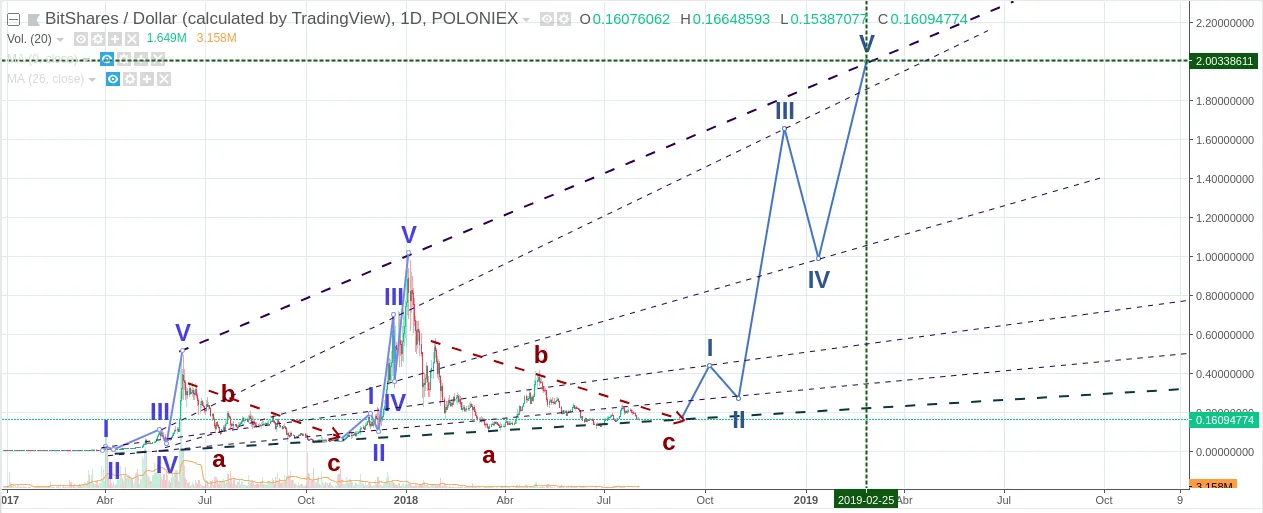
- First of all, I have identified the Simple Elliot Waves 5 Waves Up 3 waves down corresponding to an Elliot Cycle.
- In the timeframe that I have chosen we can identify 2 complete EW valid Cycles...
- Then, join equal waves by tracing a line and enlarge it till the future so you can "scale" and extrapolate the end of each wave.
Independently of the uncertainty regarding the start of the new bullish cycle, does not look so difficult for BITSHARES to reach 2 USD by the end of the year or beginning of 2019.
Not so many cryptos have a projection chart so clear, mainly because BITSHARES is one of the few "Veteran" cryptos that survives, keeping a very good health and a promising future as one of the most efficient and powerful blockchain technology, together with STEEM and more recently EOS as well .
Let me know your comments about. Hope you like it.
Thanks for reading.
*Disclaimer: This is just my personal point of view, please, do your own assessment and act consequently.
Neither this post nor myself is responsible of any of your profit/losses obtained as a result of this information.
Posted at TIMM