Point and Figure Chart 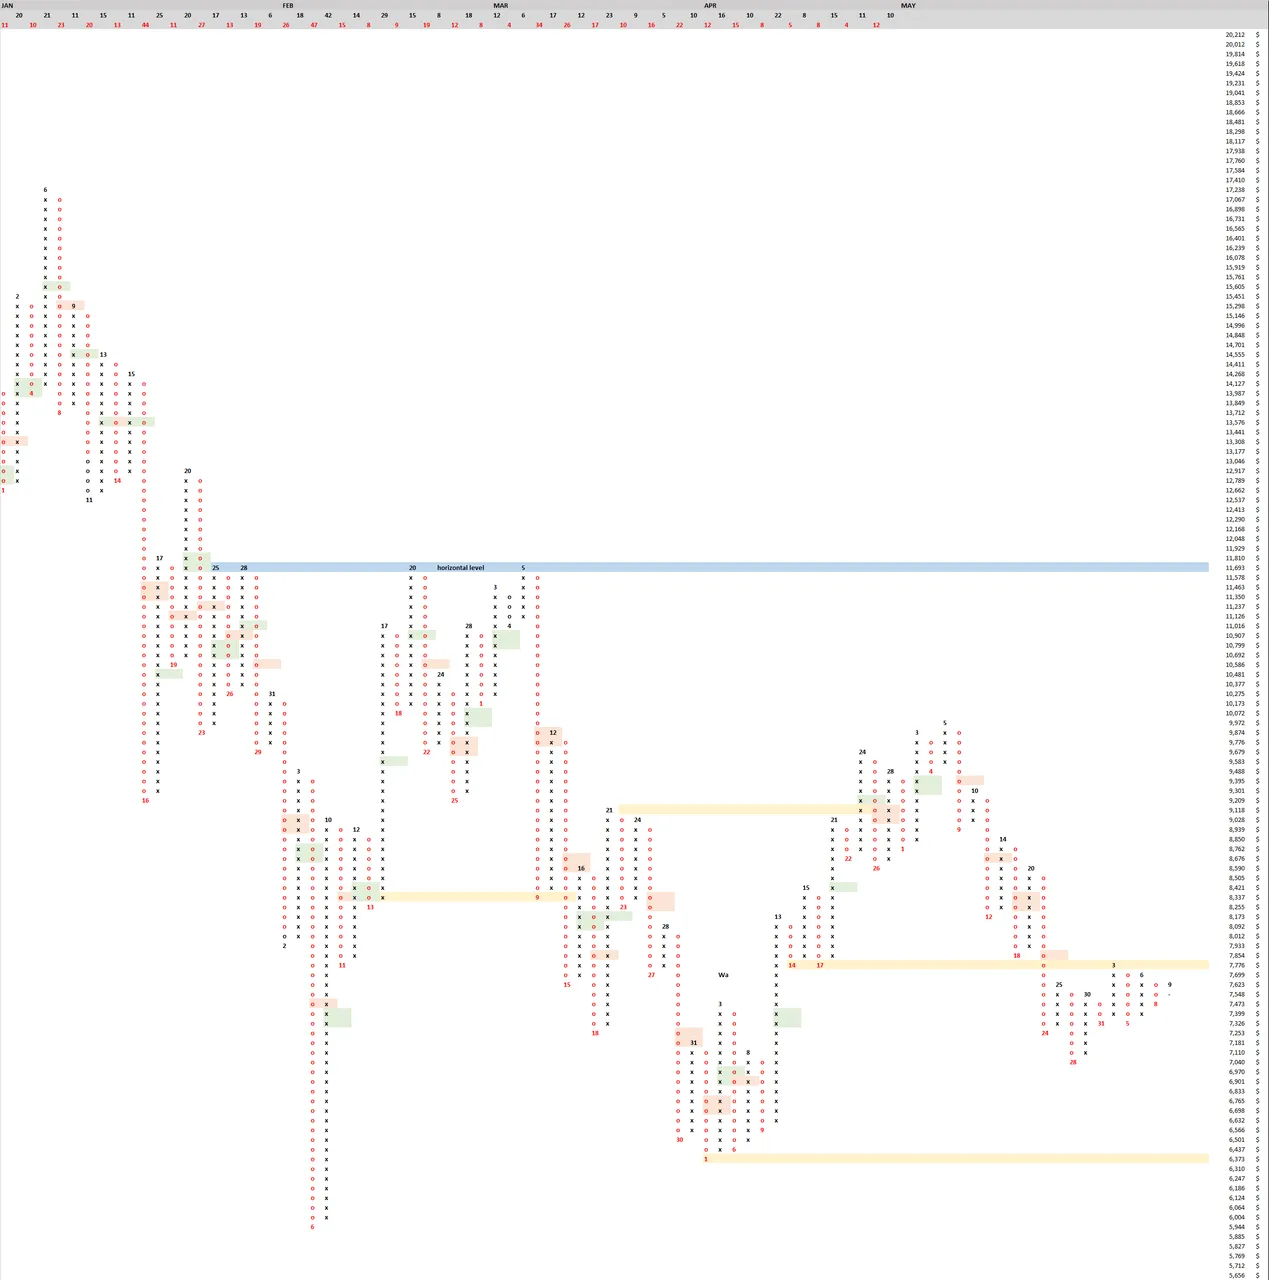 There is a beautiful lack of long poles- over 8 months of all long poles being resolved. About 2 weeks ago we resolved the last of the long poles and we have been going sideways since with smaller and smaller columns. Range is very tight, between 7,326 and 7,776. A larger range exists between 6,373 and 9,972. A breakout of this larger PNF range would signal a confirmation of break out from the large wedge:
https://www.tradingview.com/x/77nv3O36/ A large symmetrical wedge with majority of volume at the apex has formed. Bbands getting tight on the daily, the 3 day, and even the weekly timeframe. We will now have a decision. Some things to keep in mind:
We are still in a downward trend on the weekly timeframe. Since this wedge is in the weekly timeframe, that means statistically its more likely to break down.
We could see sideways price movement for another 2 months or more before the wedge resolves. That would be bullish to consolidate at this price level for so long.
Smaller wedge has formed on lower timeframe (4h-1d), as drawn in green in chart above. You will find it difficult to trade these since volume is low and range is tight.
Fundementals will decide if we break up or down. Taking a look at mainstream interest, articles about bitcoin and blockchain are less in number. Google trends reveals lower lows and lower highs for all bitcoin related searches (bitcoin, buy bitcoin, sell bitcoin, crypto, cryptocurrency). 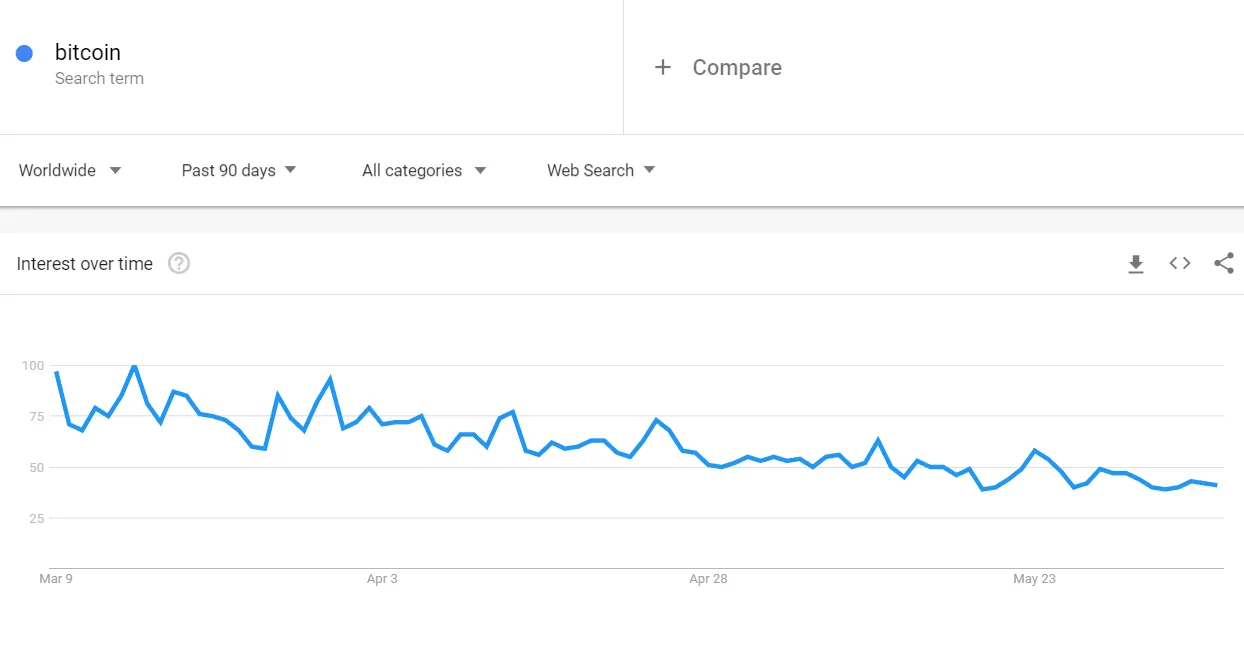 Only a few select altcoins are showing higher highs and higher lows on google trends.