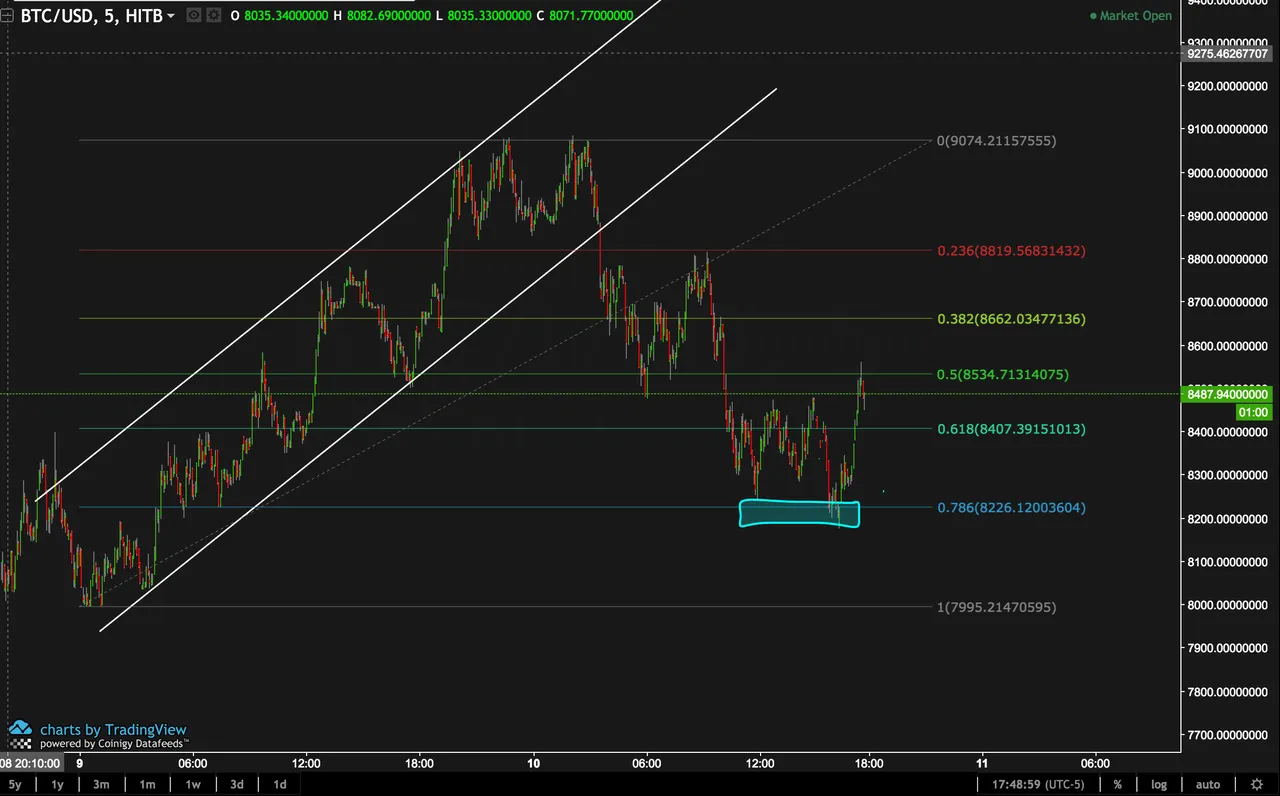
Looks like BTC has hit the .786 Fib level and bounced!
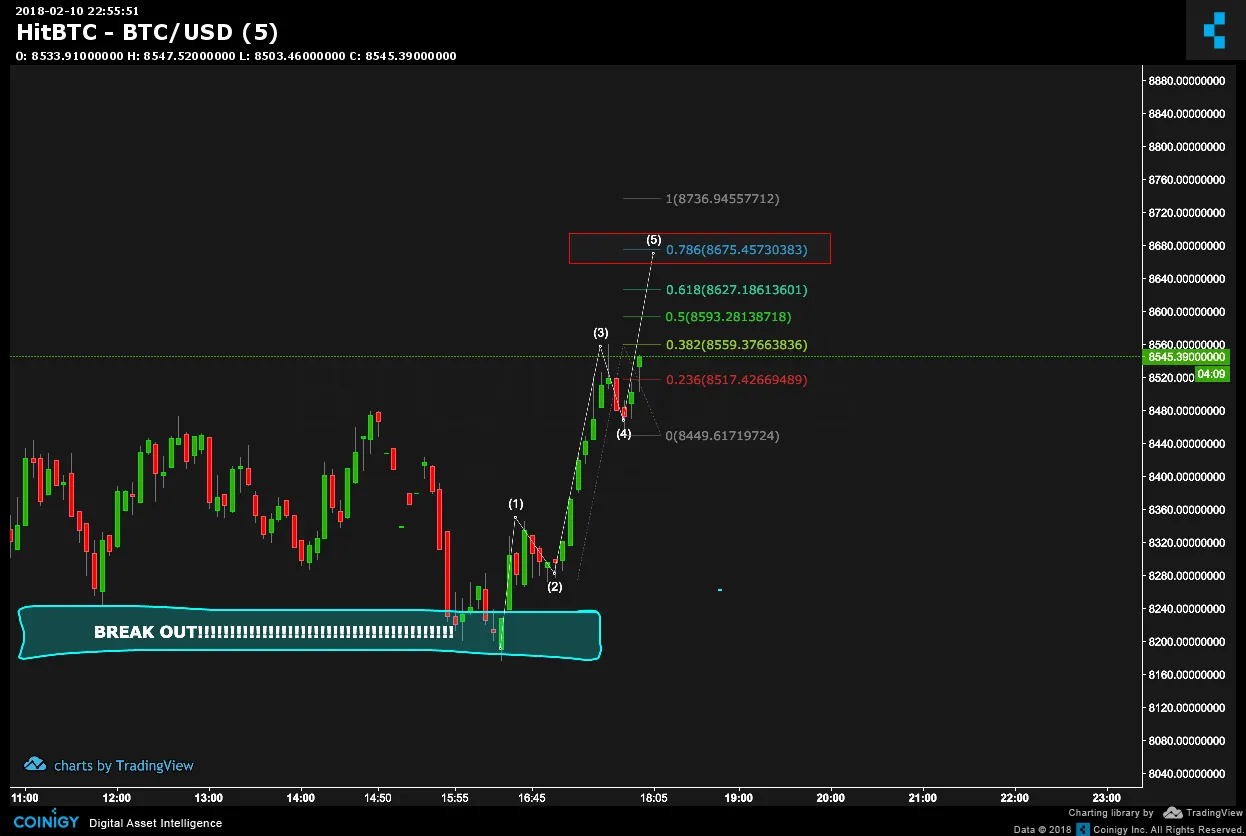
this is a 5 minute chart and to me, I see a impulse starting. my method would be great for day traders or even swing traders. This is because the way I analyze the charts shows exactly when a breakout is most probable and exactly when the dip is most probable.
On a short term? this is what I see:
Well on a short term, this is what I see: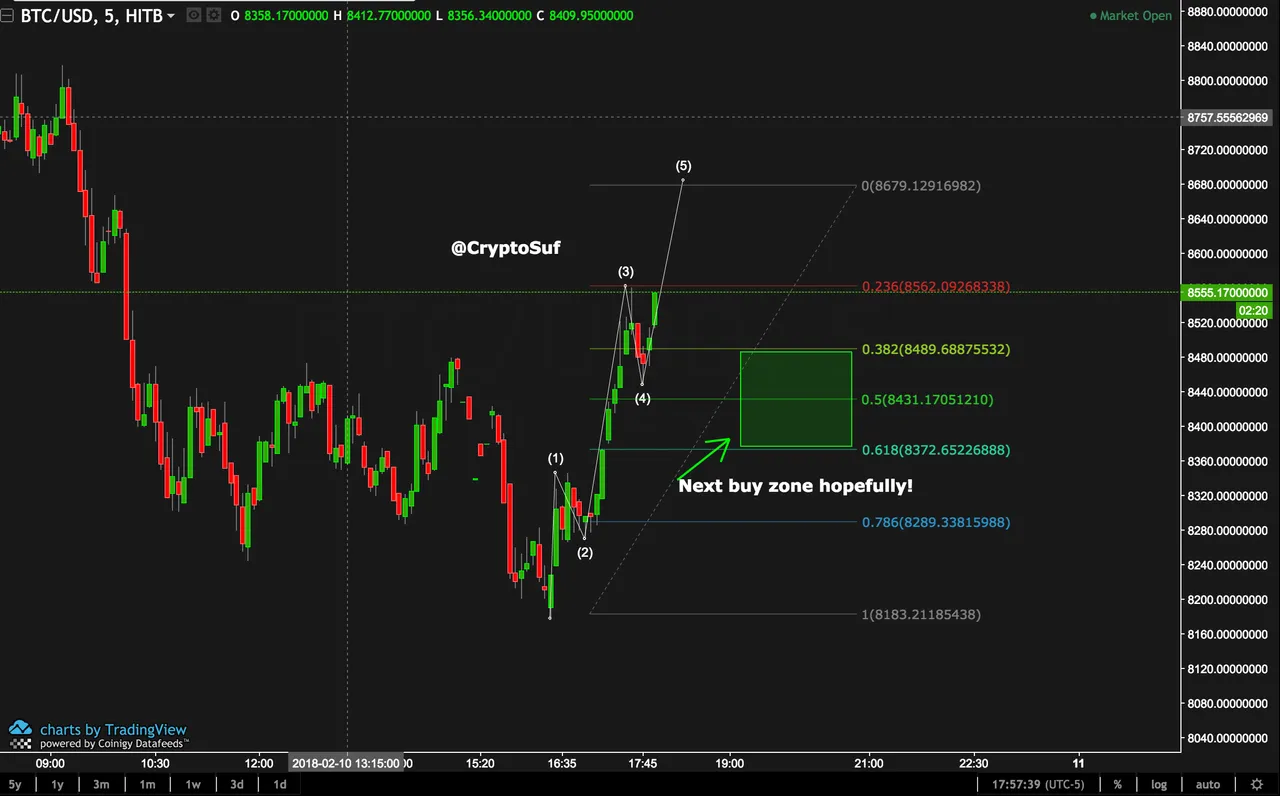
if you like what you see, you want to learn, or this has helped/entertained you at all. I would love an upvote, resteem, comment and follow please. anything would help.
Dont forget to ask questions and request coin updates!
Thanks for stoping by :)

We are not liable for any reason for profits or losses
please make your own decisions