In trading, I believe that price is not just a number it’s a story. Every candle is a trace of the decisions of millions of market participants, and every pattern is a narrative of hopes, fears, and momentum. In this analysis, I want to share how I read the BTCUSDT price movement using the Elliott Wave approach on the 4 hour timeframe. Hopefully, this can be an additional perspective for anyone who wants to understand the technical dynamics of Bitcoin without getting caught up in euphoria or excessive panic.
Main Structure : ABC Correction
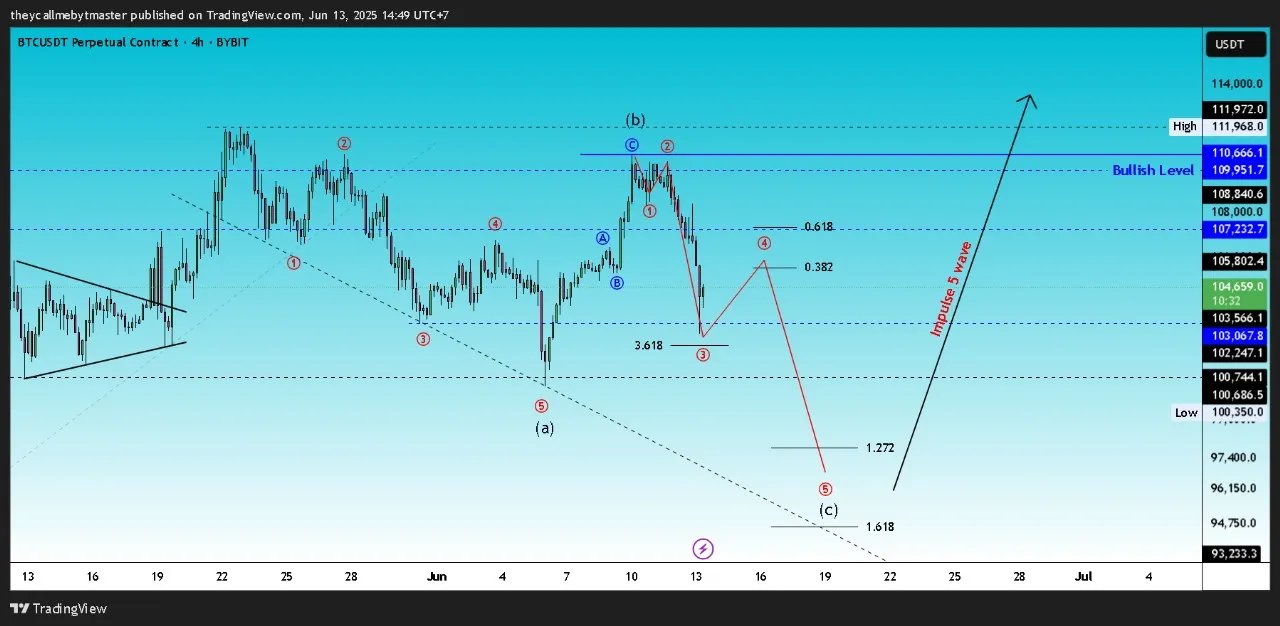
Looking at the structure from the beginning, I marked the five-wave downtrend (1-2-3-4-5) as wave (A). Here, selling pressure was dominant, with the fifth wave forming a sharp decline a common characteristic when the market is in a “capitulation” phase.
After that, the market bounced quite aggressively and formed an ABC pattern that I identified as wave (B). This wave reflects the market’s attempt to rebound after the pressure, but if you look closely, the peak was unable to break the previous high. This to me is a signal that this recovery is not strong enough to be called a major reversal.
Wave C: Still in Progress
The most interesting part for me right now is the formation of wave (C). Structurally, I see a 5-wave pattern forming again, and wave 3 has even touched the 3.618 Fibonacci extension level which often indicates seller dominance.
My current scenario is: the price will still complete wave 4, perhaps making a slight retracement to the range of 0.382 – 0.618 levels of wave 3, before continuing to decline to wave 5 of (C). The target area for the completion of this correction I estimate is between the 1.272 – 1.618 extension levels, which is around $93,000 – $95,000. This is an area that I consider crucial both as a potential rebound area, and as a final test of seller pressure.
Two Directions, One Principle: Flexible to Reality
I do not hold absolute confidence that after wave C the price will immediately fly. But if this structure completes well, then there is a strong potential for the market to enter a new impulsive phase upwards which could become a major wave 1 of the long-term trend. However, the main validation remains above the resistance zone of $110,000 – $112,000. Without a breakout of this area, I remain cautious.
On the other hand, if the price fails to bounce off wave C and instead breaks down below the key support zone, then I will prepare for a deeper correction scenario, perhaps even towards a distribution phase or a larger complex correction.
Key Level
Strong resistance: $110,666 – $111,972
Medium-term support: $100,744 and $100,350
Potential end zone of wave C: $93,000 – $95,000
These levels are not forecasts, but references to react tactically if the price reaches them.
Conclusion: It’s Not a Prediction, It’s a Reading
Elliott Wave, to me, is not a tool for predicting the future. It’s simply a language that helps me read market psychology in the form of wave structures. These structures can fail. They can also develop into new formations. And that’s the beauty of it there’s always room for adaptation.
Disclaimer: All the analysis above is my personal viewpoint. This is not financial advice. Trading involves high risk and is not suitable for everyone. Do your own research and manage your risk according to your capacity.