Bitcoin has fallen again in a downtrend after breaking out of it and also staying up for many days. It has fallen again in descending channel two days before and currently trading inside that channel.
At this moment, Bitcoin is trading at $9349 which is up 6.17% from yesterday's close of $8795.44.
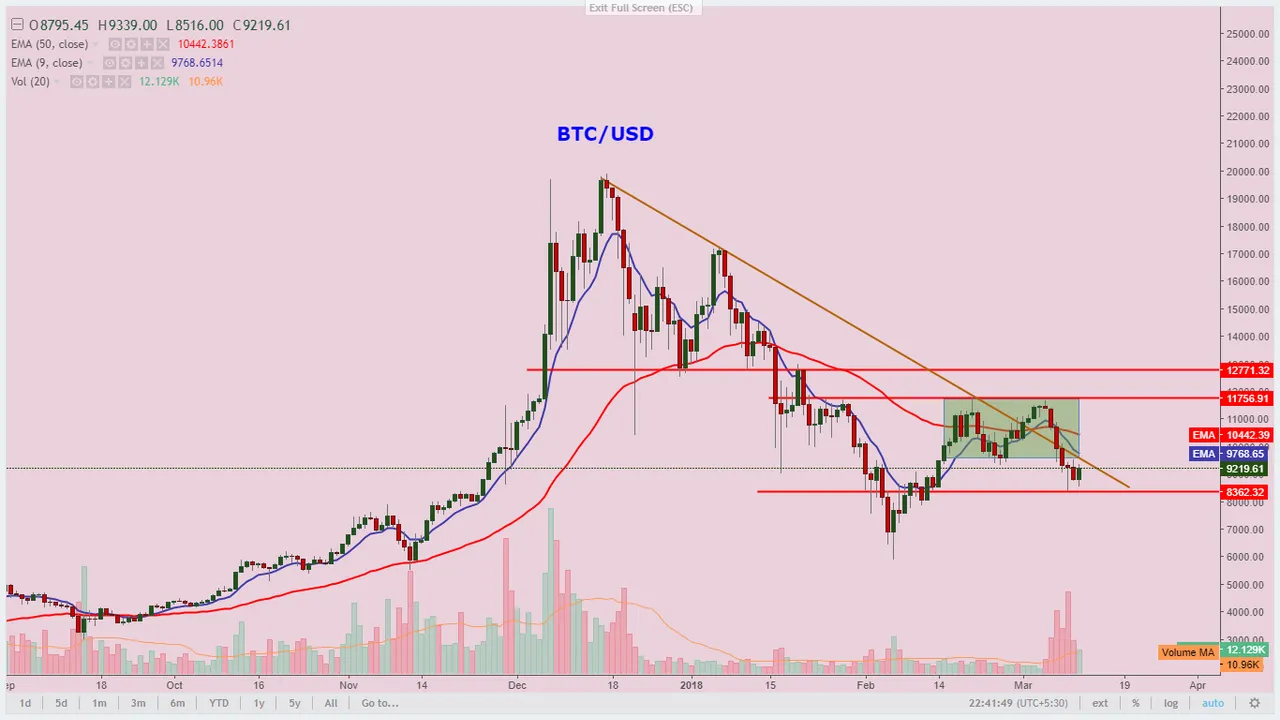
The highlighted rectangle on a chart above is depicting a consolidation or flag which Bitcoin has broken on downside which is a bearish sign. Today's upmove can be seen as a retest of consolidated or flagged area.
Momentum has also shifted downwards as moving averages i.e. 10 days EMA has currently fallen below 50 days EMA which is of bearish significance.
As far as support is concerned than $8362 level has emerged as recent support and on resistance side, $9687 level is needed to get crossed to negate the downtrend.
In summary, Bitcoin has already negated its uptrend which started after hitting a low of $5700 and currently it is just retesting it's consolidated area, so any move above consolidated area can be seen as bullish, whereas break of $8400 level will be seen as bearish.
If you like my analysis then do not forget to upvote, follow, comment@jimmyrai28
if not then criticize, this also will be highly appreciated.
You can also drop a comment in 'reply' if you want me to analyze any script of your choice.
Now you can also find me on discord channel: https://discord.gg/VvHmhvH
One can also resteem and get a free upvote on their post by just replacing http:\ with re in their post link.