This project got started because Steem Engine is missing a charting functionality.
MAPXV is an asset-backed token out of the Steem FinTech family around @mapac. It is the successor the already running MAPX.
1 token delivers two 0,2% upvotes per day (max 2 upvotes at 100% - upvotes capped at 500 tokens) and participation in the asset growth. It is also possible to mine tokens by delegating SP to @mapxv.
Unstaking cooldown: no staking = no cooldown
Other FinTech tokens already covered: MAPX, ONECENT
Check yourself before you wreck yourself
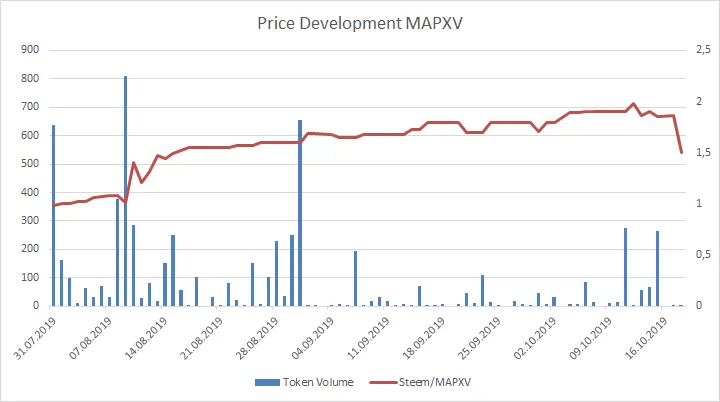
Left Y-Axis: Token Volume; Right Y-Axis: Steem/MAPXV
Time frame: 31.07.2019 until 18.10.2019
Price data is represented by daily lows in order to be conservative. Some tokens display a huge spread or sometimes don't trade at all. The daily low represents a bid where a transaction could happen.
Earlier posts in the series - ordered from newest to oldest:
SE Charts: DEC - Dark Energy Crystals
If you want to make some charts on your own:
Charting Ressources for SE Tokens
Disclaimer 1: Author owns no MAPVX at the time of writing.
Disclaimer 2: These charts do not constitute investment advice. Because why in the world would you take investment advice from a random account on the internet? What is wrong with you?