
SUMMARY
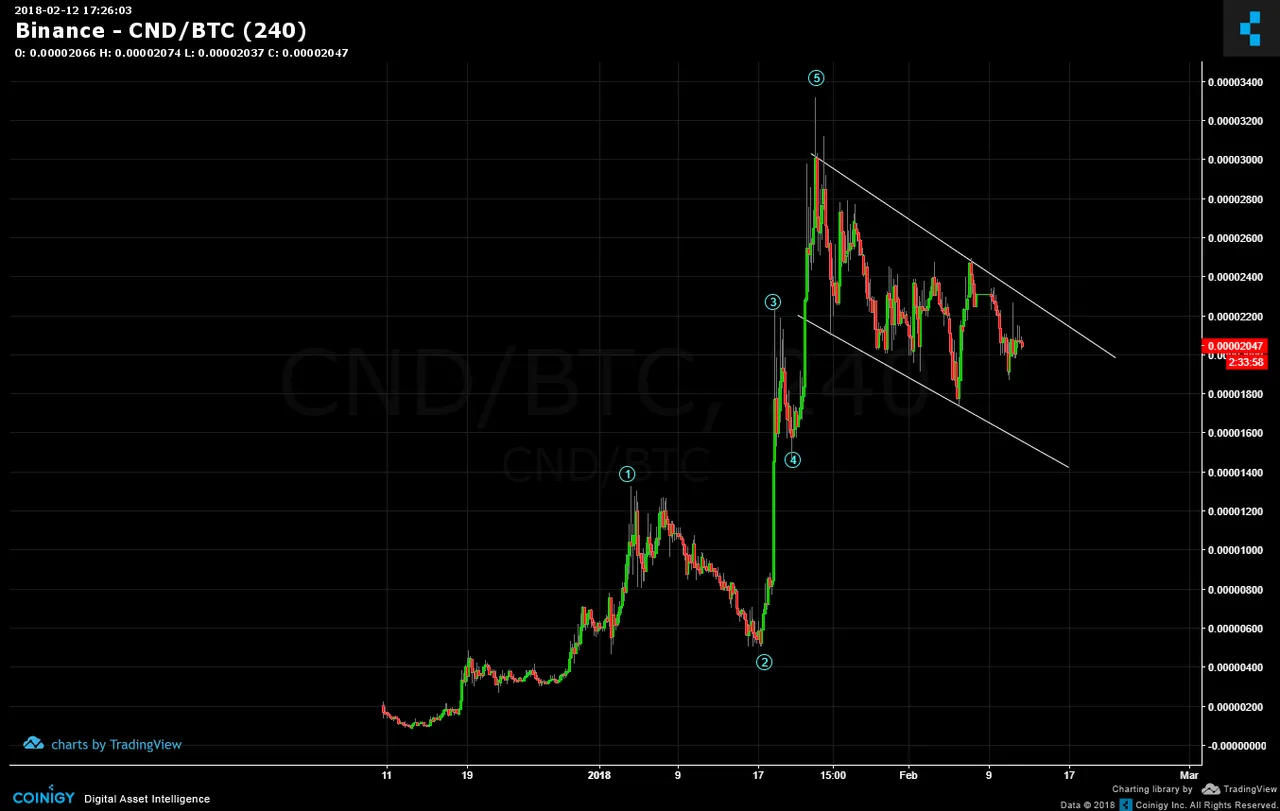
Cindicator (CND) placed a vintage five wave impulse and that is now being corrected by what looks to be a bull flag pattern. When price travels downward between a parallel line, it's considered bullish because the number of sellers diminish as price is taken lower. It's an orderly fashion of decline and so a crash secenario can be taken off the table.
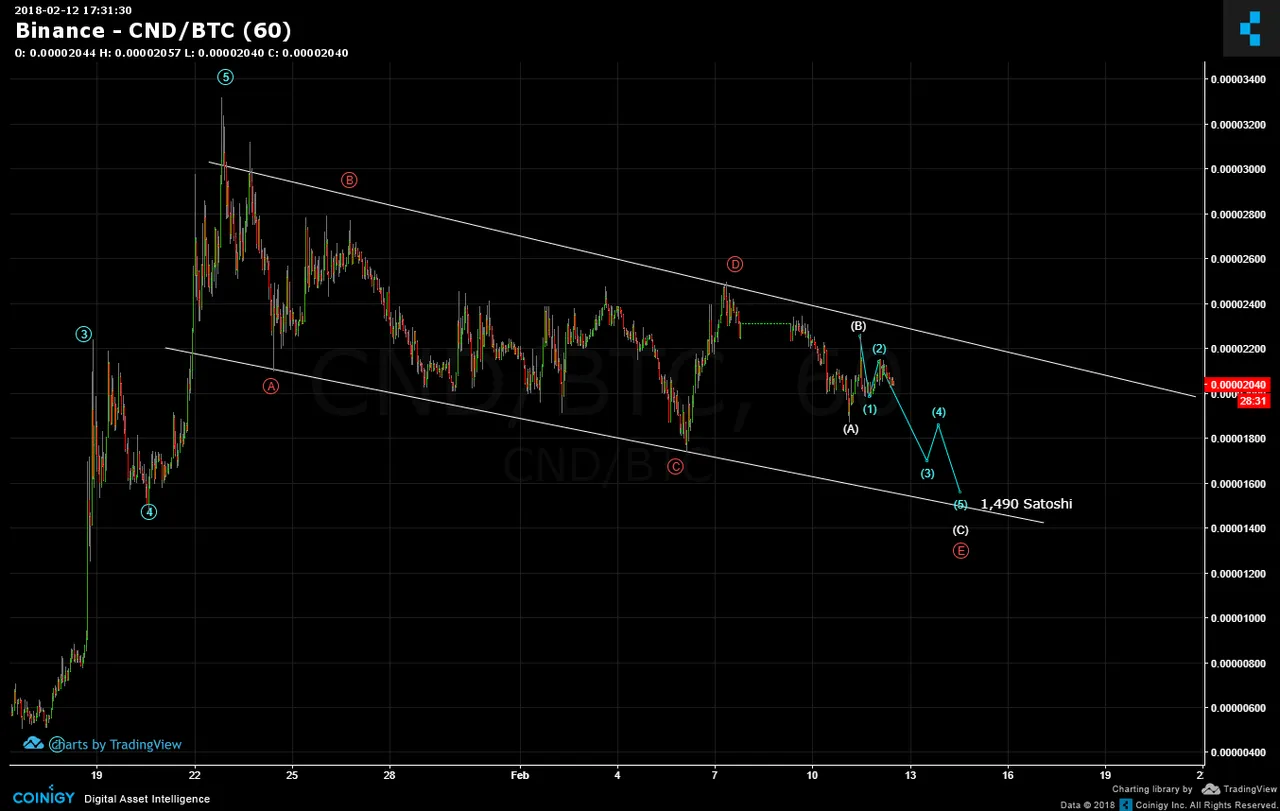
The closeup shows the abcde labeling of the flag and thus far waves a,b,c,d have completed. IF this pattern is correct, then wave E is expected to be next. The small horizontal green line is ignored as that's when Binance was down. Regardless, even a temporary shut down can't eliminate Elliott Waves. The white abc subdivides the fine E wave. The final white c wave is further subdivided into an impulse of blue fives. In this way, an approximate target of 1,490 Satoshi is generated.
Legal Disclaimer: This is only my opinion, make of it what you wish. What does this mean? It means it's not advice nor recommendation to either buy or sell anything! It's only meant for use as informative or entertainment purposes.
Please consider reviewing these Tutorials on:
Elliott Wave Counting Tutorial #1
Elliott Wave Counting Tutorial #2
Elliott Wave Counting Tutorial #3
Laddering and Buy/Sell Setups.
Laddering Example with EOS
Tutorial on the use of Fibonacci & Elliott Waves
@haejin's Trading Nuggets
Essay: Is Technical Analysis a Quantum Event?
Follow me on Twitter for Real Time Alerts!!
Follow me on StockTwits for UpDates!!
--
--

