Hello Steemers!

Today I'm sharing my $XCP/BTC chart with you.
Counterparty is a well known coin and has never really lacked volume which makes it an rather interesting market to watch.
Clean charts for the start:
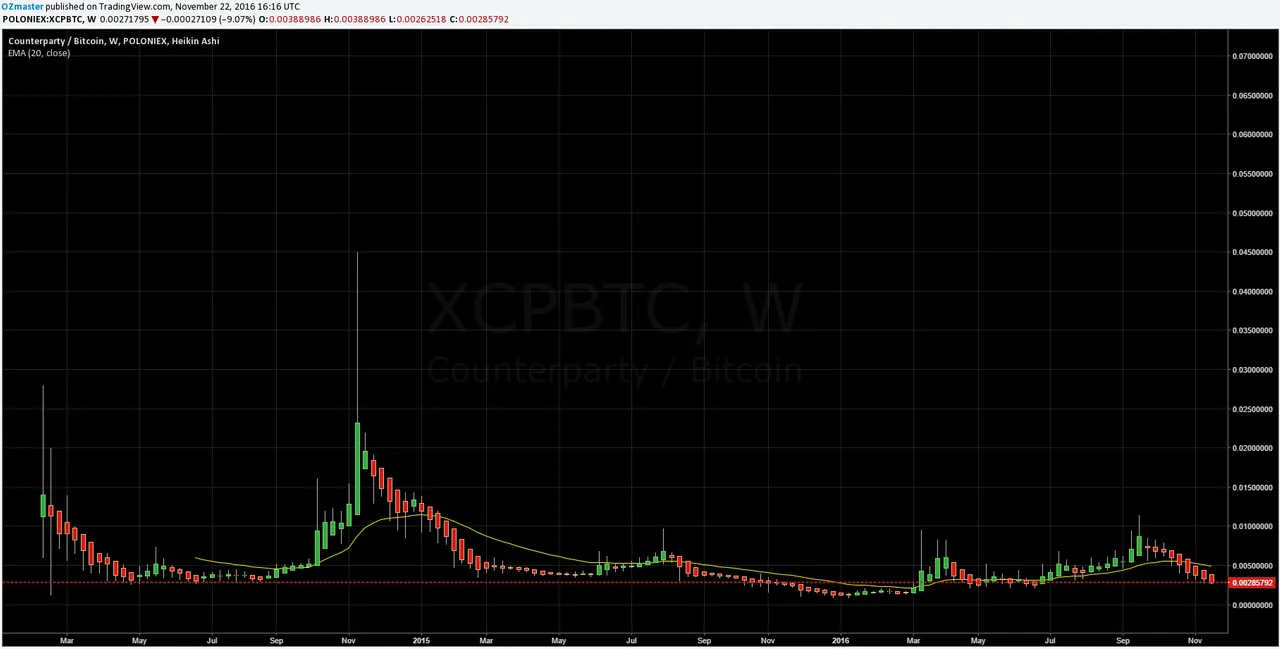
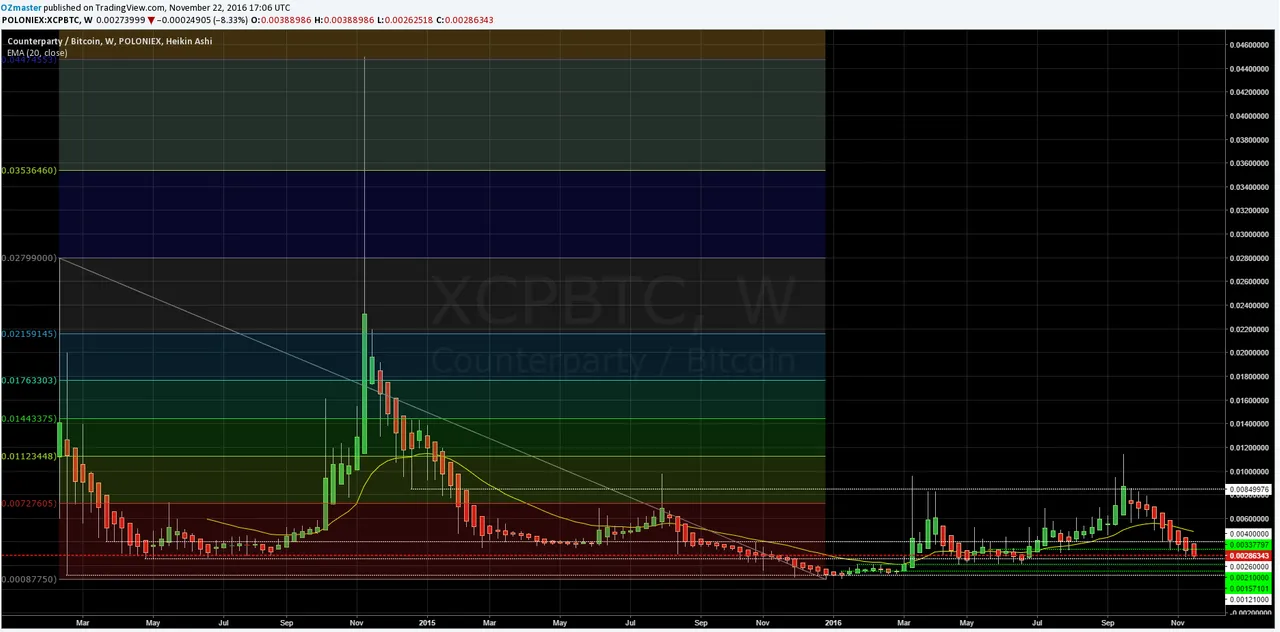
1 week chart Poloniex -clean - Nov. 22, 2016
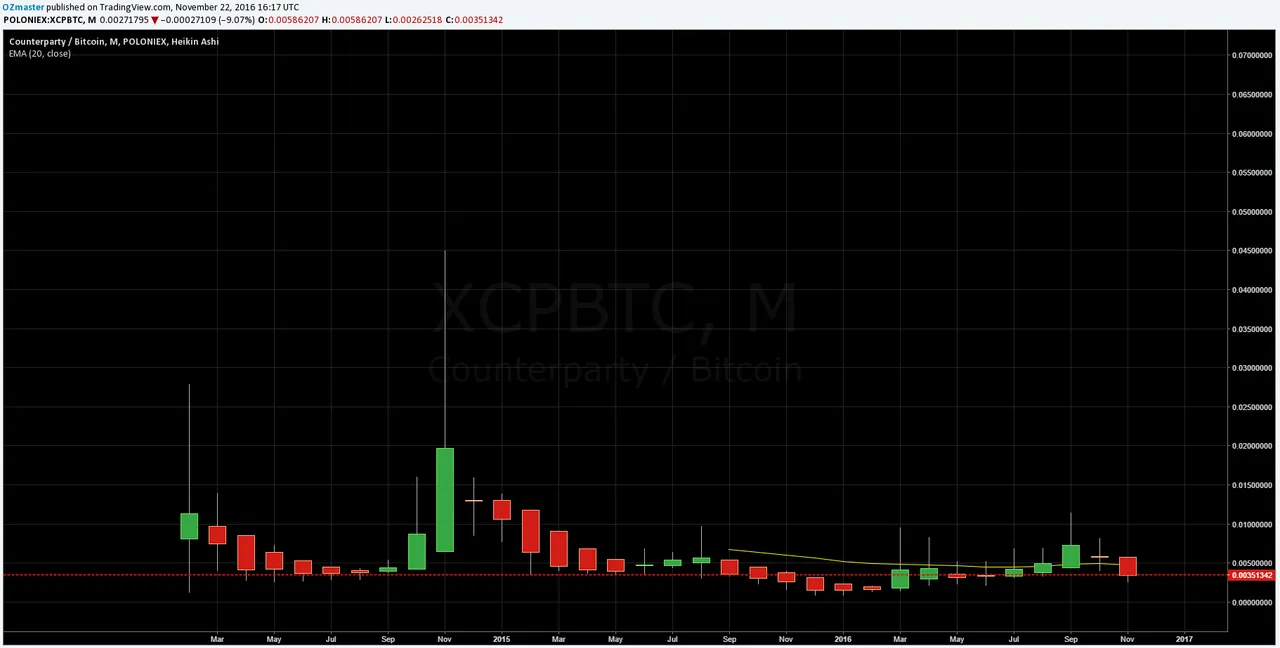
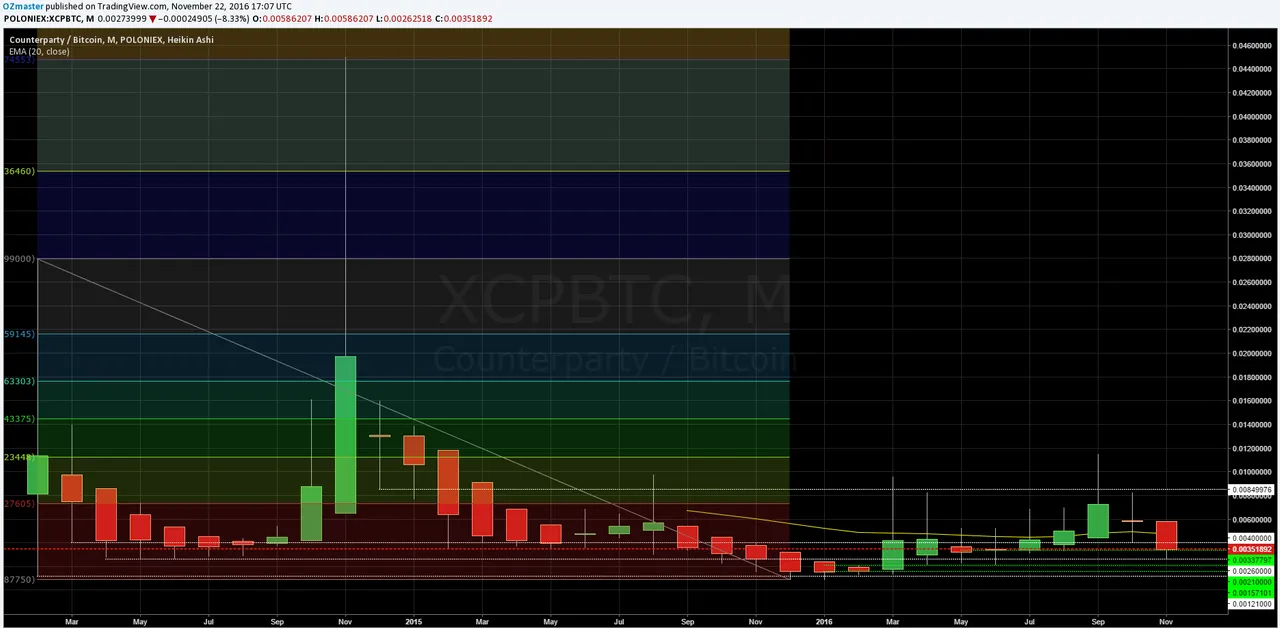
1 month chart Poloniex -clean - Nov. 22, 2016
We can see the price being in a hard downtrend since it pumped to 0.045 in Nov. 2014. all the way to Dec 2015. when it reached it's all time low point of 0.0008775 BTC. Shortly after reaching it's all time low level the price turned the trend with hard spike to 0.0096BTC with an volume of 2050 BTC on March 17th.
Again some lines on the chart, marked some lows with white lines and highs with green lines. Like last time I only drew a few to keep it as simple as possible.
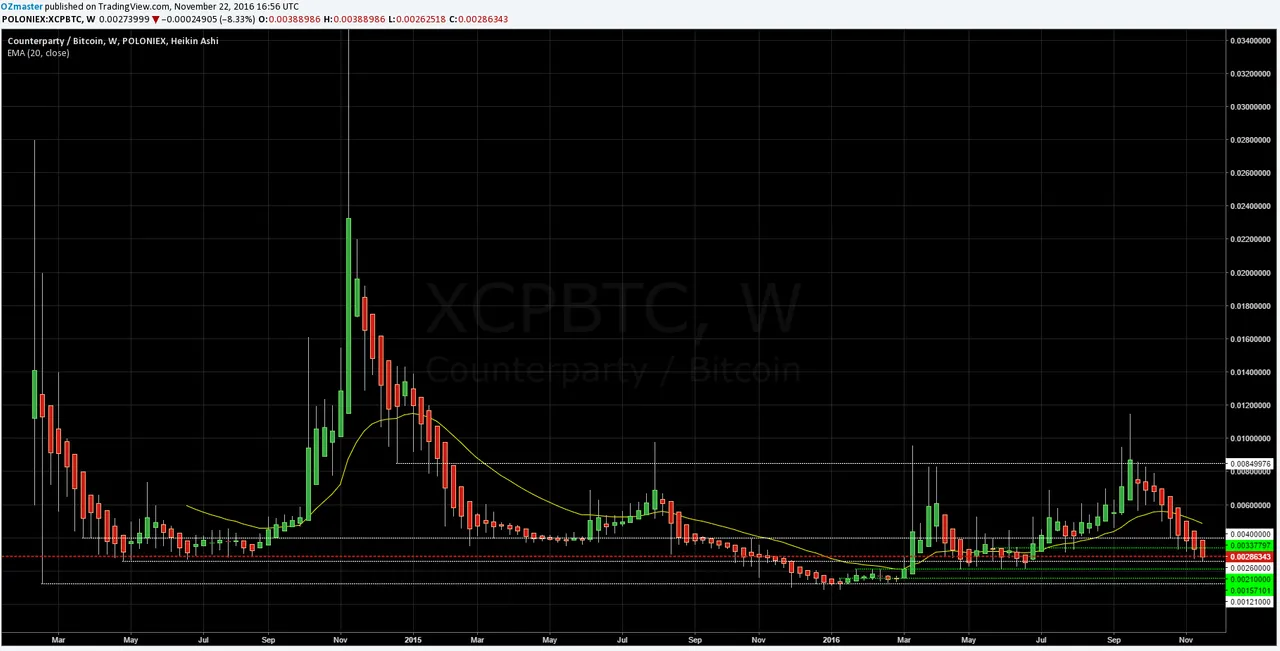
1 week chart Poloniex -lines - Nov. 22, 2016
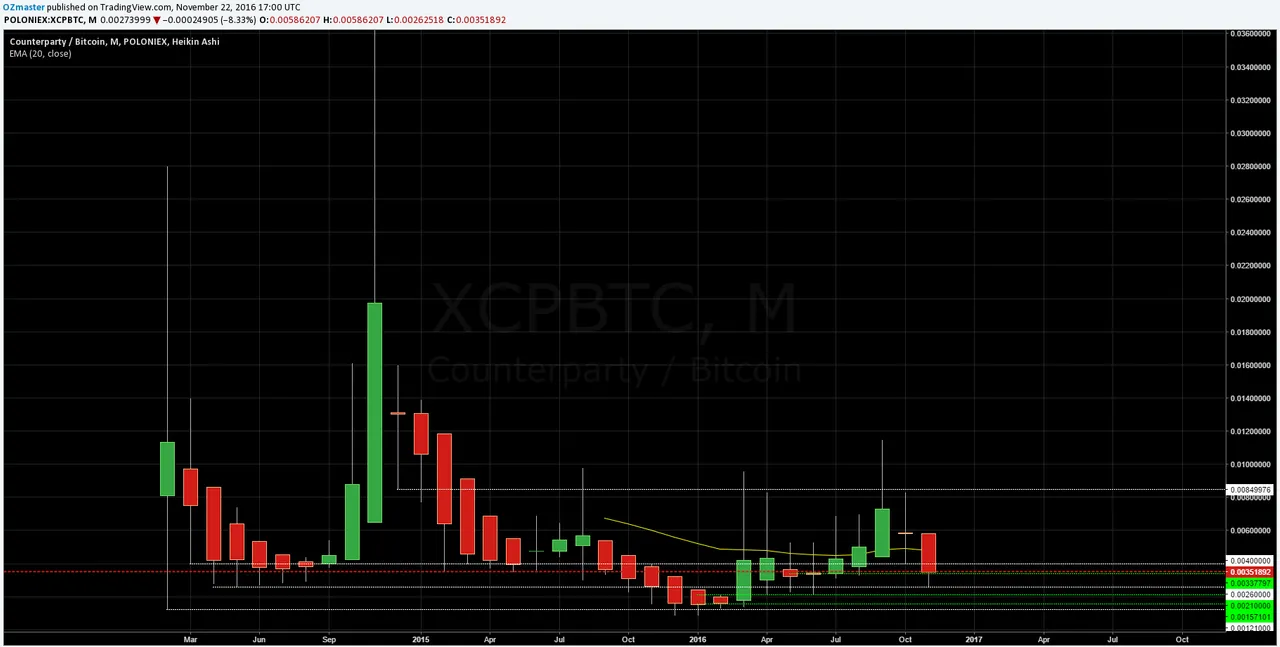
1 month chart Poloniex -lines - Nov. 22, 2016
With the lines on I spot some price movement zones, with a major accumulation area till the ~0.0085 line.
1 week chart Poloniex -fib - Nov. 22, 2016
1 month chart Poloniex -fib - Nov. 22, 2016
Fib drawn on the weekly chart.
Major accumulation zone further confirmed with the top around the first fib level (~0.00727) and the white line (0.0085) mentioned above.
With the fib on, one can see some possible targets on the uptrend.
What to expect next?
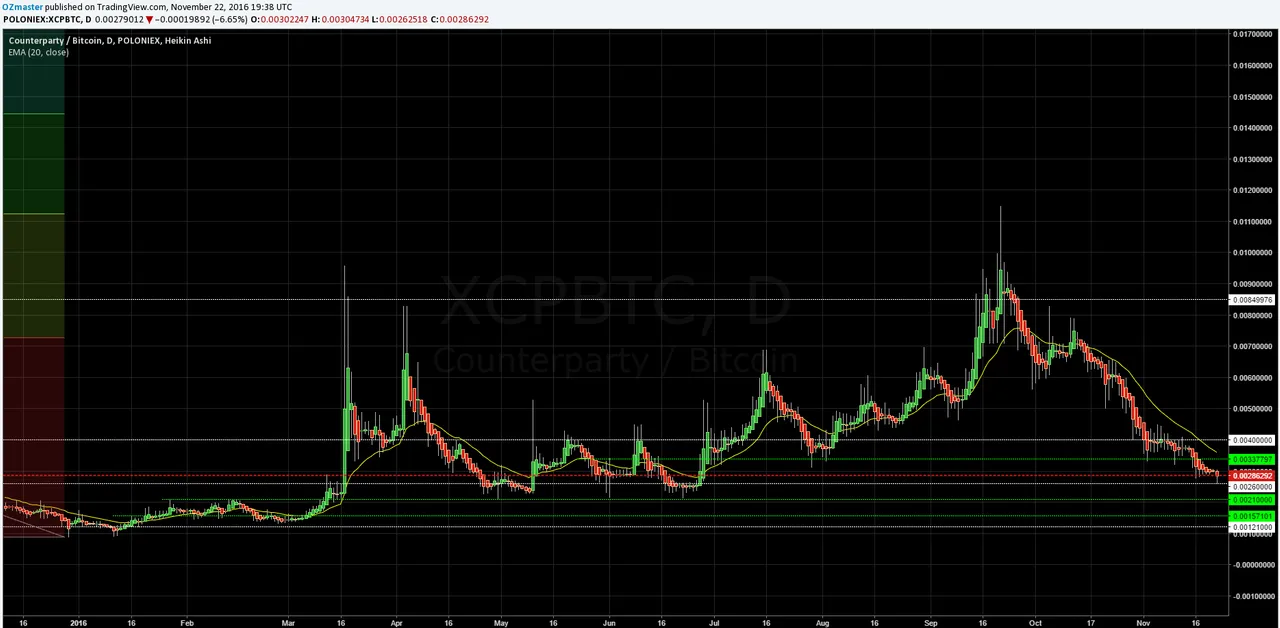
1 day chart Poloniex -zoomed in - Nov. 22, 2016
The price hit the 0.0026 level which is a previous local low and might act as a possible support for a bounce and even another reversal towards the uptred, however it still has room to go down more and meet some support down there.
Bellow we have the possible support of 0.0021 which was a earlier local high from before the March pump, same as the next support level, the 0.00157 line and at the end the 0.00121 support line.
COMMENT
Once again, I will post the comment by commenting as it involves my personal opinion!
Thank you for understanding!
If anyone has any questions or need's help fell free to ask, I will try to explain as fast and as best as I can.
Critics, comments, reply's, counters, advice's, etc. are always welcome!
Have my charts helped you in any way?Let me know with a comment below :)
Are there more people who are doing TA?
Please post the links to your TA's posts into the comments as well!
DISCLAIMER
I am showing multiple scenarios on the price movement, in the post itself I do not take any stance, either bullish or bearish. I am not responsible for neither you’re winning nor you're losses upon trading! the "comment" section is my personal opinion and does not mean I have to or do hold any positions in the given market.
Everyone who uses TA develops his own unique charting style, please keep that in mind.

Kind Regards, OZ :)