So this morning around 8:30-9 a.m. eastern time ZEC made a huge green candle on the daily chart and busted back up to the top of the bollinger band range. It went from $250 to $330 in a matter of hours as shown on the hourly chart below.
ZEC / USD Hourly Chart
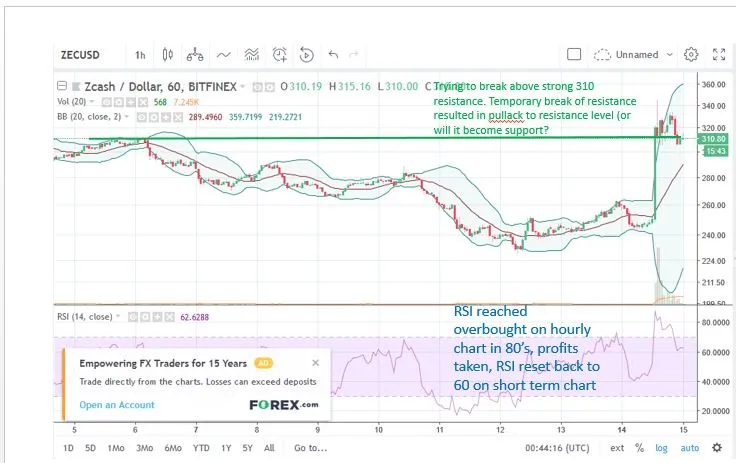
As you can see, a resistance level at 310 slowed it down as people took profits as short term traders do when a spike happens and a strong resistance level is tested. We have some good things going as far as technical indicators are concerned...
- RSI hit the 80's (overbought territory) on the hourly chart and needed a brief pullback. The consolidation that ensued brought the hourly RSI back down to the 60's which gives a good bit of room for another potential surge upwards
- The price went outside the upper bollinger band for a couple of hours which is extremely bullish, but steady as she goes.
Now that we've looked at the short term view, let's take a look at the daily chart and see just how strong that 310 resistance level is and the price history around this level, shall we?
ZEC / USD Daily Chart
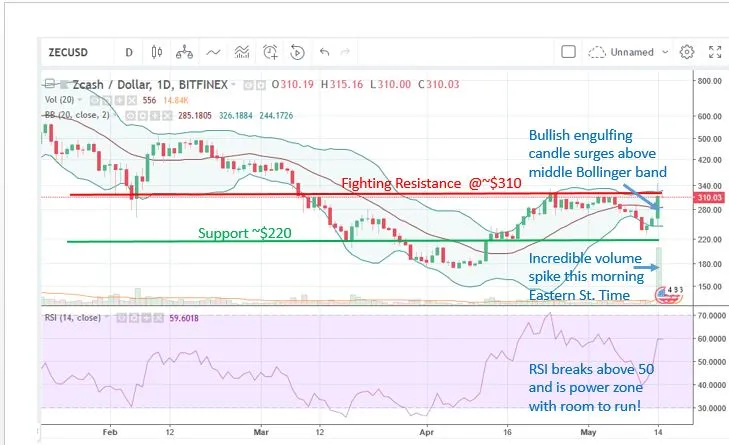
- So we see the RSI on the daily time frame is also in the 60's which is good. Power zone is 50-70 and we're right smack in the middle of that
- Again, the bollinger band situation looks like a go for more potential bullish movement as that huge beautiful bullish engulfing candle touched the top bollie and retreated a bit, thus the RSI reset
- We are currently teetering on the brink of breaking above the 310 resistance which was once a support but once it dropped below that line it became a resistance level, and a strong one at that
- Recently the daily chart has seen more days in the upper bollinger band range than the lower but the price did dip below the middle band until today's huge volume spike seen in the lower right hand side of the chart.
Time will tell whether this is just hype, a pump, or the beginning of a big move upward. I read a few articles that expresses concern about the privacy aspect of the coin but I didn't find any news to justify the huge spike on a day when most other cryptos were up or down a couple of percent. A 25% or so gain in a matter of hours is a huge thing on a slow day like this for the other coins.
Makes me wonder what the near term future holds. Could this 310 area be broken to the upside? It knocked the price back down as far back as October, served as a support level in early February, and has acted as resistance for the past few weeks as well as in mid March. Is it time that it's shattered once and for all?
We'll just have to watch the charts. But I sure am glad I hold a decent amount of ZEC. It made my day to see this rally today. It sure is odd how a couple of select cryptos can rally so strongly when others struggle to move 3% in a day.
Congrats to all the ZEC HODLers and fingers crossed for more uptrend!
Long term is the name of the game baby! Just gotta stay in it and keep the faith!
If anyone can tell me what triggered this the first person to answer satisfactorily gets a 100% upvote on your comment. You could probably find this answer from another blogger but I want to hand out a nice half dollar (approximate value) vote to someone who can tell me what happened today with ZEC while I was at work.
May the odds be ever in your favor :)