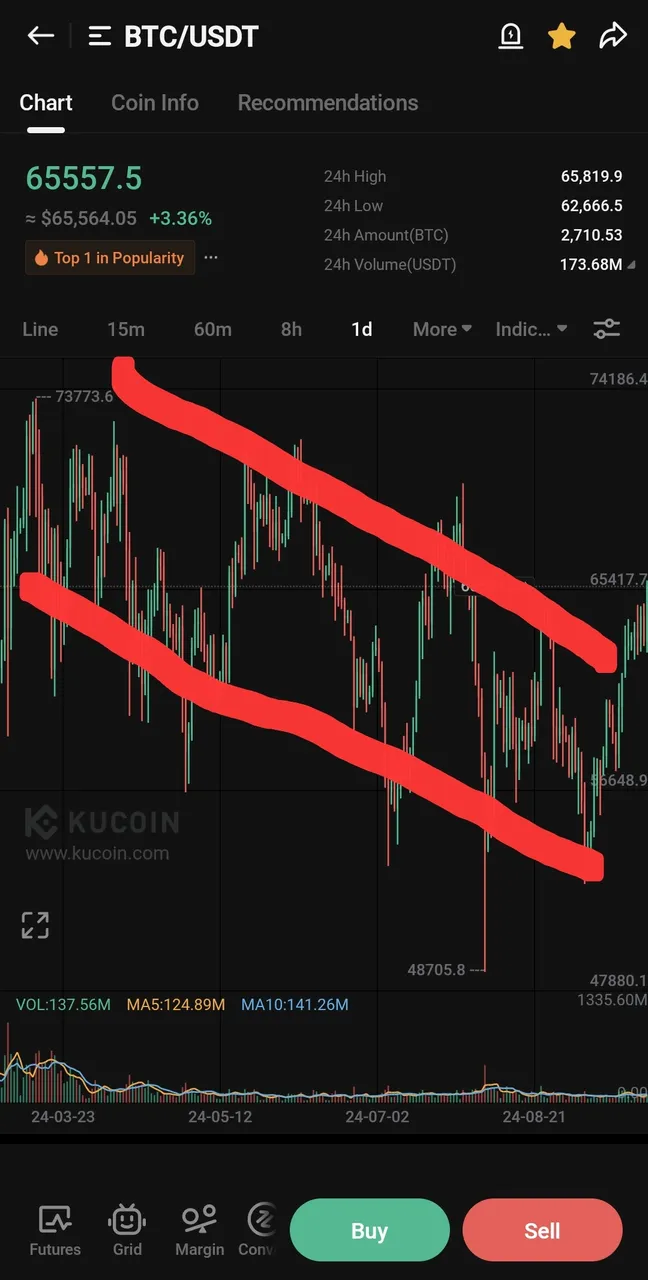
Well, well, well, finally there is some movement on the charts that might actually be meaningfull on the long term. The Last couple of months since March we have been stuck in this giganticbut super tedious channel.
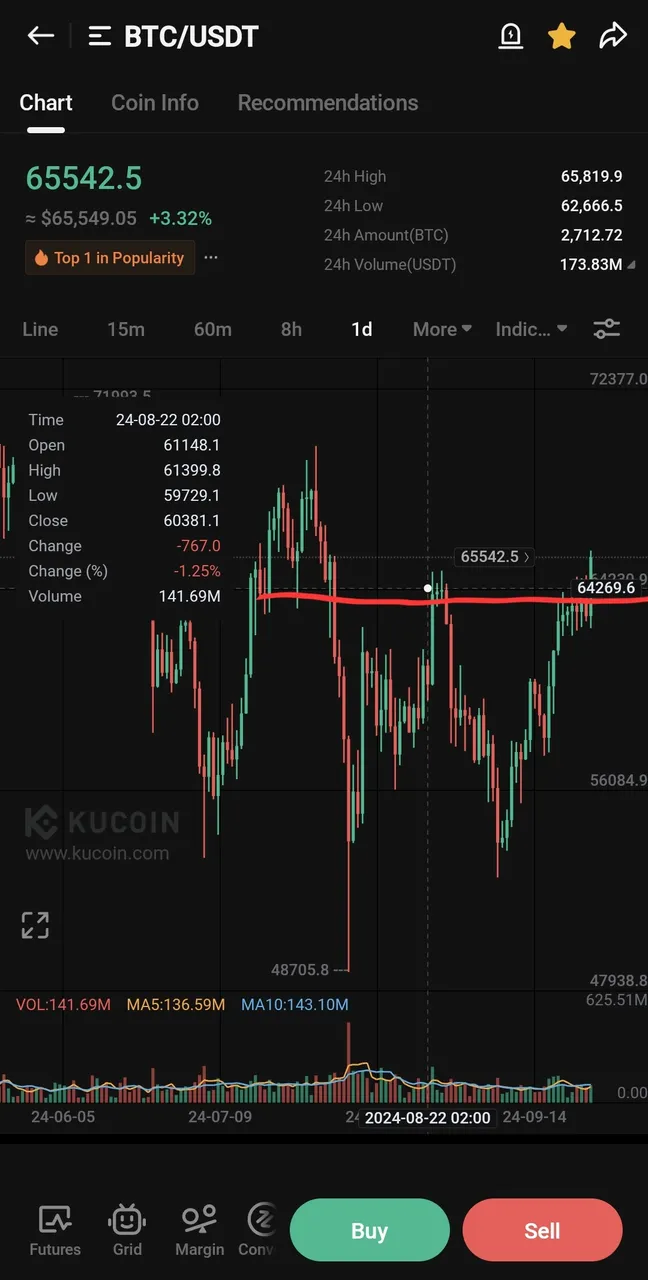
Still with way more decent numbers than a year ago, bit not really like a lot was bound to happen again. That just might have changed today as Bitcoin has crossed 65.2K and with that making a higher low (instead of these endless lower lows)
Take a look at this endless channel of boredom!

Nearly everything happened in this descending channel with some breakouts here and there. What we need now is to hold this level to actually confirm this as a trend reversal and not just having a fake out.
And yeah in the next image you can we see we stuck around at the 66-67K region in July where there should be some more resistance. But we atleast took out that 65 region making rhat higher low and this just might be the change we need

Trends always seem based on the historic data and people are referring to a bullish Q4 as that is 'almost always the case'. And if we believe it, that means people will we buying. Because that always worked, and it always works until it doesn't right?
Or will this time be different? :D
Looking forward to the upcoming weeks to see what happens! Are you positioned as you would want?