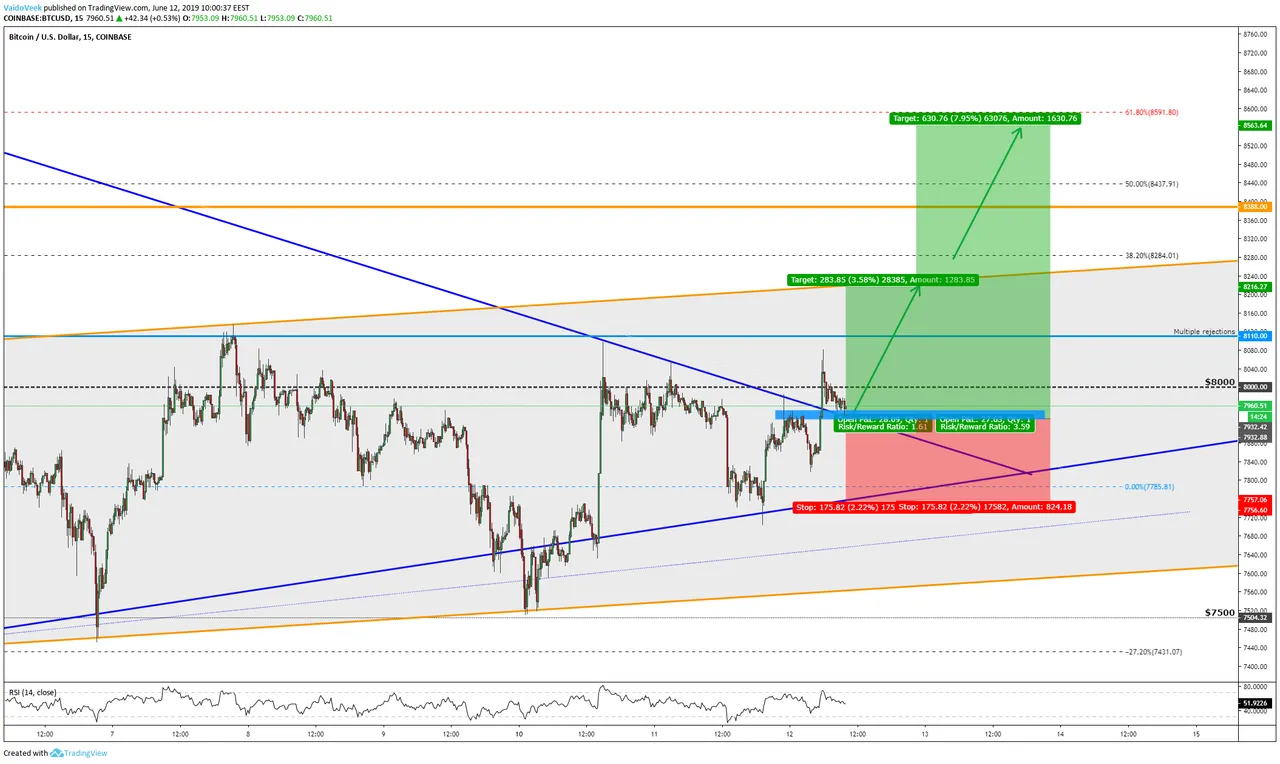
Two day's ago we had a higher high candle close (the candle which got a close above $8,000), a few hours ago we got a higher high candle close on the 1H.
This 1H candle was pretty powerful and the buyers pushed it straight through the blue counter trendline (down-trendline). Yesterday, I said that those two blue trendlines make a Triangle chart pattern. Triangle chart pattern has breakout opportunities to either direction and currently, we have upwards breakout confirmed on the 1H and on the 4H timeframes.
That's why I think we might see a small push upwards. I said small push because of the higher timeframe bearish sign, remember my last idea post, the last Weekly candle close gave us a really powerful bearish candlestick pattern called Evening Star but currently, we have a pretty good short-term buy setup.
If the market makers don't start to ruin some current action then we might see something like this:  The trade criteria:
- Some hidden higher high candle closes on different timeframes.
- The blue counter trendline got cracked with a powerful candle. It shows that there is a lot of buyers and they together managed to push it above.
- The blue counter trendline worked previously as a resistance, the strong candle breakthrough gives us an indication that this trendline should start to act as a support.
- As you see on the 15 min. chart then there is previously worked resistance level which now becomes support.
- 1H EMA200 should act as a support level .
- Altcoins area on the recovery mode.
- The tiny short-term trend is upwards
- Golden crosses between different EMA's
The trade becomes invalid if the price starts to fall below the lower blue trendline .
The first target area should stay around $8,200
The second target should stay around $8,500
Do your own research and if it matches with mine idea post then you should be ready to go!