I keep saying that the market is incredibly oversold
The injured former-optimists-turned-bears will have you think that their doom-and-gloom outlook on crypto is the correct approach.
If you're really short-sighted enough to believe that a 5 month downtrend trumps an 8 year positive trend, then you're what I class as being "beyond redemption", and I don't know if I can even help you. Nevertheless, I'm saying this for those who will listen: the market is oversold and is not going to stay that way for much longer! You can quote me on that.
From http://www.afrizap.com/en/realistic-tattoos/3d-tattoos-bursting-at-the-seams-inspirationsweb-com_
Bursting at the seams
What makes me so sure?
Well, in addition to the general positive nature of the long-term crypto total market cap trendline:
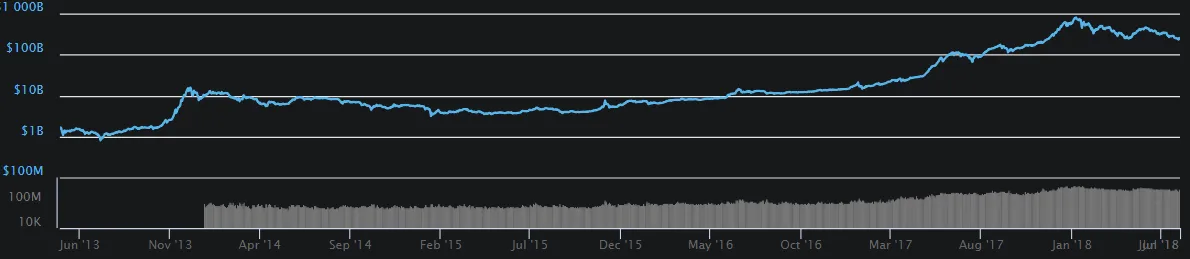 From https://coinmarketcap.com/charts/
I have also started to notice something new. I have a lot of different coins and I check them all every day. For the past few weeks I've seen a trend which I could not explain. Coins would break out and spike in price. This is nothing new in crypto, it happens all the time, but here is the funny part: I could find no reason for the breakouts. No news, no hype, no tweets, rumours, listings, SEC regulations, lifting of bans etc. Nothing. They've been breaking out spontaneously for no particular reason. Weird.
Then this morning it hit me: the bears (majority of the market) are still too scared to turn bullish and start buying. They're all still waiting for yet another low (good grief...) as discussed in the link in paragraph 1 of this post. Last night I watched TenX shoot up over 30% for no reason, this morning I watched Power Ledger shoot up 90% - and then I realised what it was: the market is bursting at the seams.
Despite the bears holding it down through the sheer willpower of their negative sentiment, pockets of the market can no longer contain their buy impulses and spontaneous, isolated price spikes are occurring. I regard this as a very positive sign and confirmation that this market is more than ready to take off.
Shortly after my mini-revelation, the entire market shot up roughly 10%. It seems that sub $6000 BTC / sub $250 bn total market cap has simply become unsustainably cheap, no matter how the bears feel, and a spurt of rapid buying equalised the market at a higher level.
Further confirmation
Some of the more trustworthy TA tools I use are the Stochiastic Indicator and RSI. Like a MACD, they can be adjusted to show just about anything, but the mechanics behind these indicators is, I believe, more relevant than looking at the difference between two moving averages of unequal integration times.
As always, I harbour distrust and a modicum of disdain towards most of those who practise short-term TA. Let's look at the RSI and Stoch Indicators for BTC in the short-term:
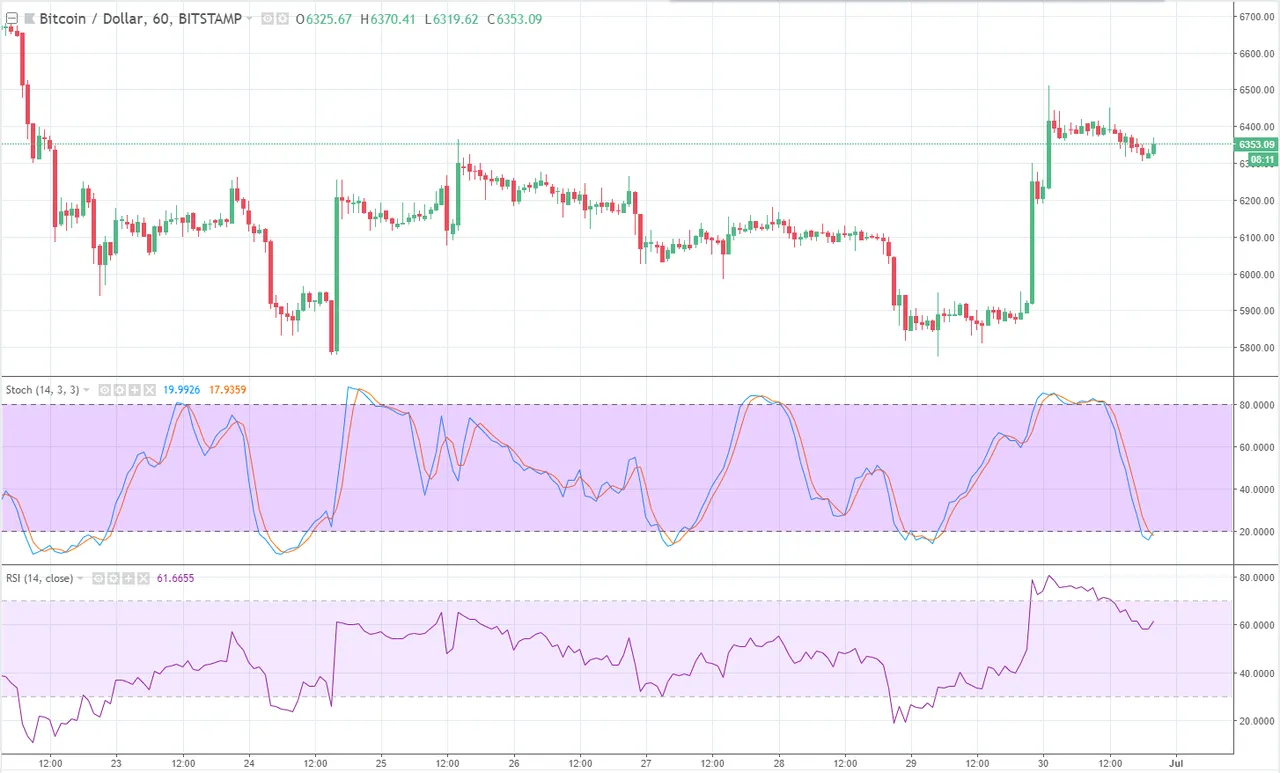
Made by Bit Brain with TradingView
Yes, siree! The RSI and stoch on that chart show me a whole lot of inconclusive nothingness! Let's zoom way out and try that again...
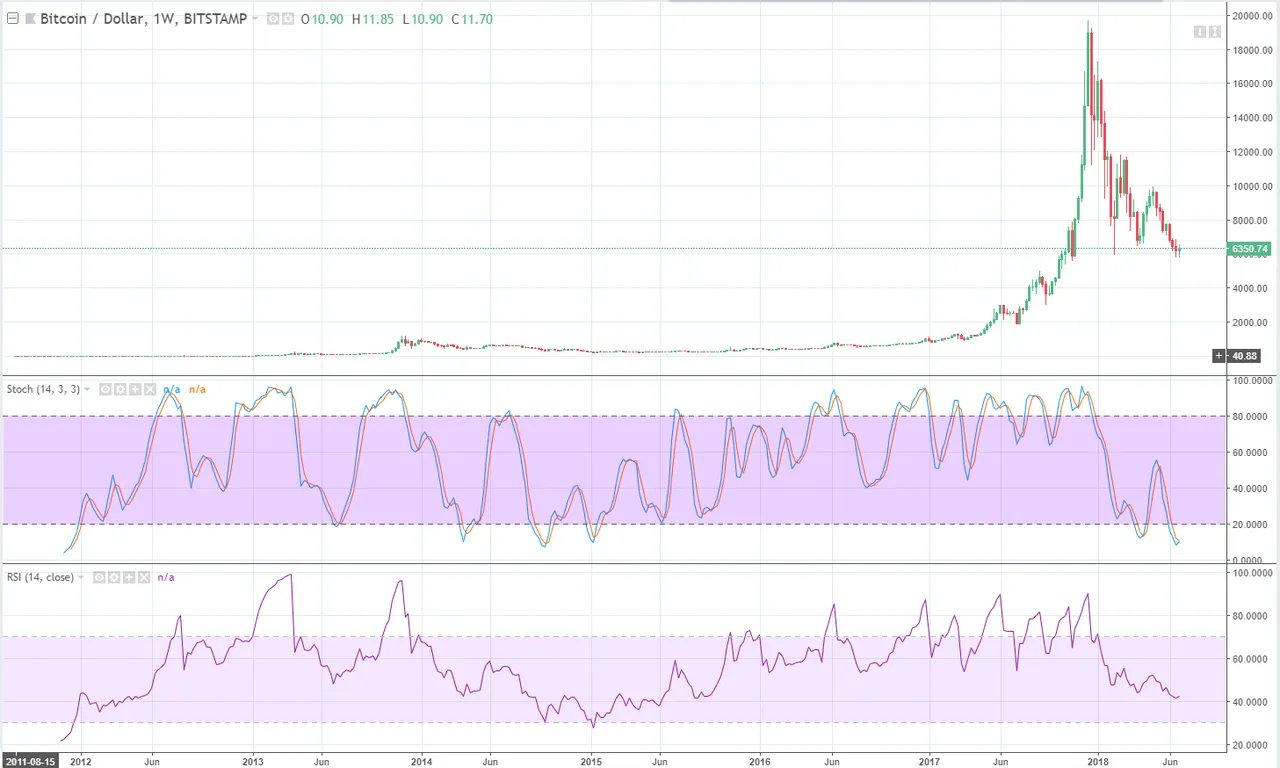
Made by Bit Brain with TradingView
That's going back to 2011 and using weekly candles. That shows me something!*
Looking at the right-hand side of those indicators I clearly see a "Buy" indication and (according to the Stoch) an oversold market.
Generally I prefer to use an RSI over a Stoch when dealing with crypto, but I make an exception when working with USD pairs as in this case. The Stoch seems to work better with logarithmic growth, so both are useful in this case.
Very briefly for those not familiar with these indicators: Both the Stoch and RSI are used to indicate how overbought or oversold a market is. The closer they are to the top or bottom of their ranges, the stronger they indicate a sell or buy signal respectively. Stoch uses closing prices compared to price range over time, while RSI uses average gains vs average losses over a time range. The effect of both is to indicate change in price movements. But unlike most other indicators, the great thing about them is that they are leading indicators and not trailing ones i.e. they show something before it happens. A trailing indicator like a MACD will show a price event after it happens, nice for confirmation, but no good for prediction. Looking at the chart above I see a turning RSI and a turning, heavily oversold Stochiastic Indicator. Read into that whatever you wish, But I will make no secret of the fact that I think it's predicting a bull run.
Invest accordingly after you have done your own research.
Yours in crypto,
Bit Brain

Published on

by Bit Brain