Good evening crypto-investors, as is evident we are living these last days in the name of bearish trends for the entire crypto market. The cryptocurrency market has gone from a capitalization of 800 billion to 480 billion. From here it is evident that there was a panic-sell, people took money out of the cryptocurrency market for fear of a bubble burst.
In my opinion, the strong growth that has taken place since December 2017 sooner or later had to give rise to a correction, and, due to the fact that many investors entered in December, when the markets were all beautiful, and they saw in a short time to multiply the money invested, suddenly, we saw the ground missing underfoot when the correction began, and it was chaos.
Now the sharks will come forward to make a clean sweep by speculating on this strong fall that has been there and that will continue to be there in the near future.
My trading strategy
To explain my current trading strategy I will use the Ethereum. The graphs below are in fact ETH / USD and all are heikin ashi charts.
Ethereum went from $ 400 to $ 1300 in a month, so it was foreseeable that sooner or later there would be a correction. With this I do not mean that it is only a price action, obviously the correction has certainly been dependent on external factors such as the latest news from China and Korea against the cryptocurrency market.
But what a trader must try to understand is when and if the trend can return to the upside again.
To do this I use my own trading strategy, the Heikin Ashi combined with the EMA10
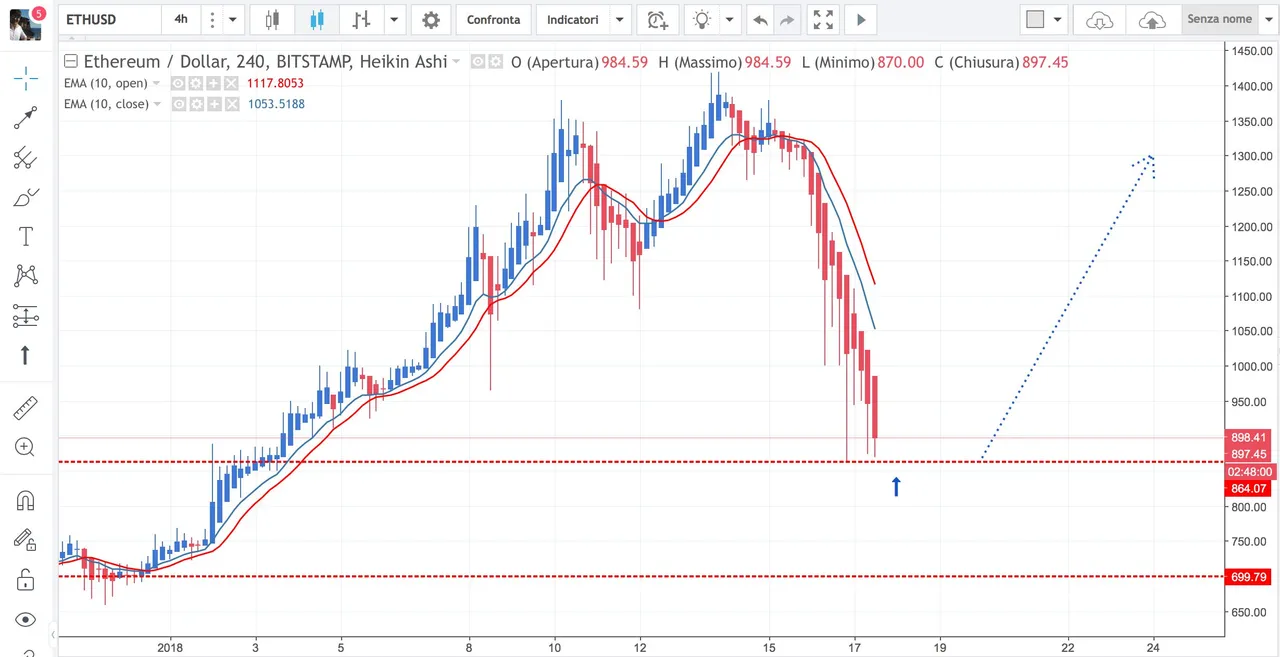
The EMA 10 provides for the use of two exponential moving averages at 10 periods one on closing and the other on opening. When the one on the closing (blue) cuts from the bottom to the top on the opening (red) then there is a bullish signal, if instead it cuts from top to bottom then the signal is bearish.
I am looking for the signal to enter a new start of trend bullish.
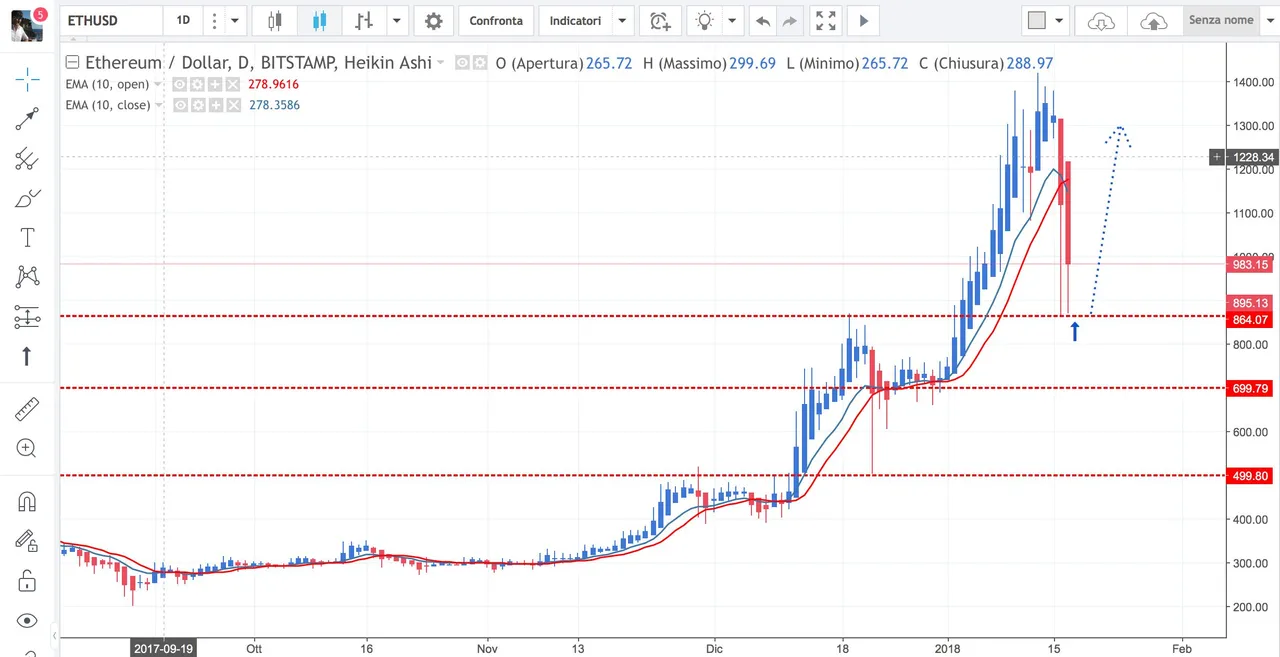
The first chart is Daily. I have identified 3 supports: 864USD, 700USD, 500USD.
What I expect is an inversion on one of these 3 supports.
To get a long input signal, I have to make sure that a medium has been touched, and for now the 864 USD has been touched.
Then, in the graph H4, I verify if there is an intersection of the EMA (the blue one cuts the red from the bottom up). In this case it is not there yet.
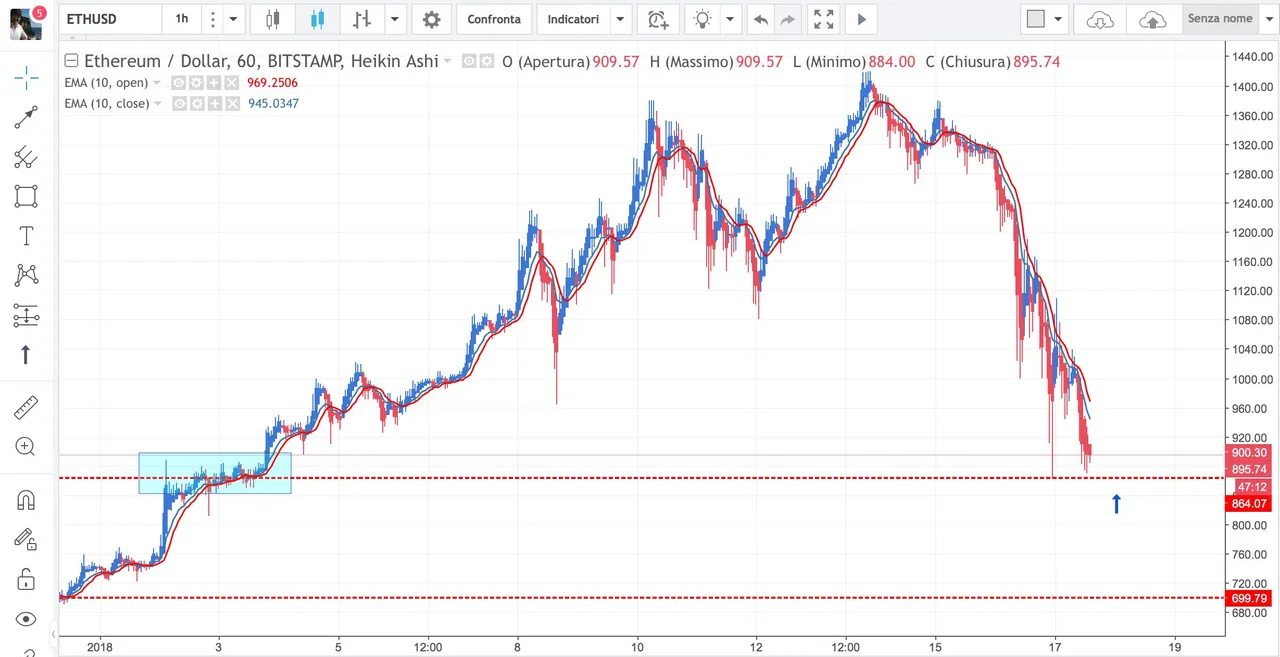
So I move into the H1 chart and check if there was a bullish Asik Ashi here.
It still has not been there
How do I invest?
If I start in H1 to see one or more bullish Heikin Ashi, in H4 I start to see an intersection from the bottom to the top of the blue EMA10 with the red one, then I start to build my bullish position with a stop below the support (in this case 864USD).
All clear?
In doing so, I can filter out many false signals while at the same time minimizing possible losses and thus optimizing profits.
If you appreciate my work, I invite you to upvote my posts, to share them, to become my followers on steemit.
Thanks for the attention.
Disclaimer
This described is my personal trading strategy and does not in any way want to be an invitation to invest or a financial advice. So if you decide to follow my strategy you will feel relieved of any responsibility.

Buona sera cripto-investitori, come è evidente stiamo vivendo questi ultimi giorni all'insegna di trend ribassisti per tutto il mercato crypto. Il mercato delle criptovalute è passato da una capitalizzazione di 800 miliardi a 480 miliardi. Da qui è evidente che c'è stato il panico-sell, le persone hanno tolto i soldi dal mercato delle criptovalute per paura dello scoppio di una bolla.
A mio avviso la forte crescita che c'è stata da dicembre 2017 prima o poi doveva dare luogo ad una correzione, e, per via del fatto che molti investitori sono entrati propio a dicembre, quando i mercati erano tutti belli floridi, e hanno visto in poco tempo moltiplicare i soldi investiti, ad un tratto, si sono visti il terreno mancare sotto i piedi nel momento in cui è iniziata le correzione, ed è stato il caos.
Adesso si faranno avanti gli squali che faranno piazza pulita andando a speculare su questo forte ribasso che c'è stato e che potrà continuare ad esserci nel prossimo futuro.
La mia strategia di trading
Per spiegare la mia attuale strategia di trading utilizzerò l'Ethereum. I grafici che seguono riguardano infatti proprio ETH/USD e sono tutti grafici heikin ashi.
Ethereum è passato da 400 dollari a 1300 dollari in un mese, era quindi prevedibile che prima o poi ci sarebbe stata una correzione. Con questo non voglio dire che si tratta solo di price action, ovviamente la correzione è dipesa sicuramente da fattori esterni come le ultime news da Cina e Korea contro il mercato delle cryptovalute.
Quello però che un trader deve cercare di capire è quando e se il trend potrà tornare nuovamente al rialzo.
Per farlo io utilizzo una mia personale strategia di trading, la Heikin Ashi abbinata alla EMA10
La EMA 10 prevede l'utilizzo di due medie mobili esponenziali a 10 periodi una sulla chiusura e l'altra sulla apertura. Quando quella sulla chiusura (blu) taglia dal basso verso l'alto quella sulla apertura (rossa) allora c'è un segnale rialzista, se invece la taglia dall'alto verso il basso allora il segnale è ribassista.
Io sto cercando il segnale per entrare su un nuovo inizio di trend bullish.
Il primo grafico è Daily. Ho individuato 3 supporti: 864USD, 700USD, 500USD.
Ciò che mi aspetto è un inversione su uno di questi 3 supporti.
Per avere un segnale di ingresso Long devo assicurarmi che un supporto è stato toccato, e per adesso quello a 864 USD è stato toccato.
Poi, nel grafico H4 verifico se c'è una intersezione delle EMA (la blu taglia dal basso verso l'alto la rossa). In questo caso non c'è ancora.
Quindi mi sposto nel grafico H1 e verifico se qui c'è stata una Heikin Ashi rialzista.
Ancora non c'è stata
Come investo?
Se comincio in H1 a vedere una o più Heikin Ashi rialzista, in H4 comincio a vedere un intersezione dal basso verso l'alto della EMA10 blu con quella rossa, allora comincio a costruirmi la mia posizione rialzista con uno stop poso al di sotto del supporto (in questo caso 864USD).
Tutto chiaro?
Così facendo riesco a filtrare molti falsi segnali e al tempo stesso a ridurre al minimo le possibili perdite e ottimizzando così i profitti.
Se apprezzate il mio lavoro, vi invito a votare i mei post, a condividerli, a diventare miei follower su steemit.
Grazie per l'attenzione.
Disclaimer
Questa descritta è una mia personale strategia di trading e non vuole in alcun modo essere un invito ad investire o un consiglio finanziario. Pertanto se decidete di seguire la mia strategia mi riterrete sollevato da qualsiasi responsabilità.

Chart ETH/USD Heikin Ashi D1

Chart ETH/USD Heikin Ashi h4

Chart ETH/USD Heikin Ashi h1
