How can you define when a volume is of supply or demand?
Low to shorter time frames. Also by the shape of the candle and by the level of price in which the asset is.
It is not an accurate method (none is on this aspect) but it gives you a very good idea.
For example, if you have a candle with a lot of volume and a long wick up, it is very likely that the volume corresponds mostly to the supply pressure.
People desperate to sell.
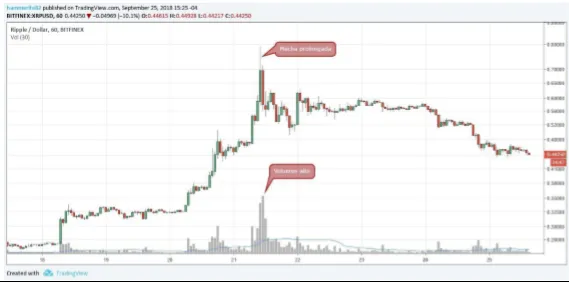
Look at that candle and look at the top wick. Is long.
It has high volume.
Anyway, anyone could object: "But the body of the candle is longer than the wick and is also green".
And well, yes, you would be right.
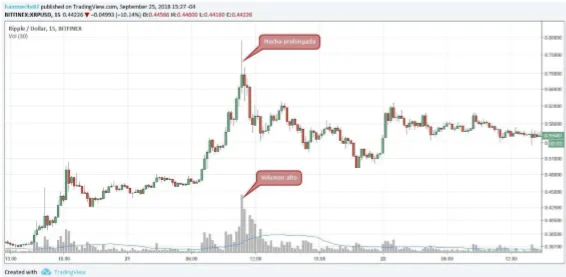
But look at the story that tells us the graph if we go down to 15 minutes.
From that candle of an hour, the last 15 minutes (from 10:45 - 11:00) were what contributed more to the general volume of the candle of an hour. If to that you add that we were marking new maxima and that 0.8 USD was a level of resistance ... Well, it has all the elements necessary for that volume to be a selling force.