“Wow, this is AWESOME!”
That was my first thought when I discovered this cryptocurrencies correlation matrix:
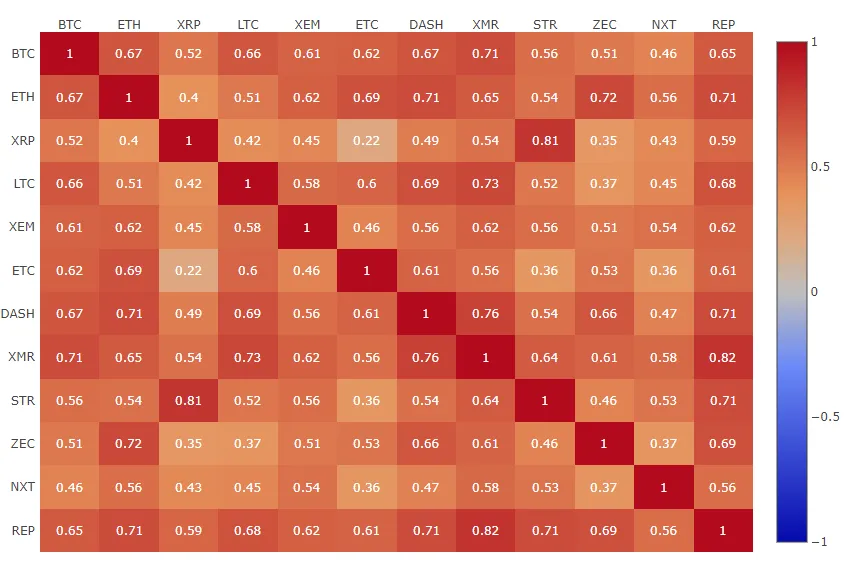
As someone who bets on a growing cryptocurrency market with a diversified cryptocurrency portfolio using a 70/30 long-term/short-term approach, knowing how investments correlate is very valuable information.
The website Sifrdata.com provides this kind of information. The correction matrix above shows how the 12 cryptocurrencies displayed correlated with each other in the last 90 days. All correlate positively which means on average they move in the same direction. So take for instance BTC and XMR, which have a correlation of 0.71. This means that on average when Bitcoin increased by 1%, Monero increased by 0.71%.
In general the numbers can be interpreted as follows:
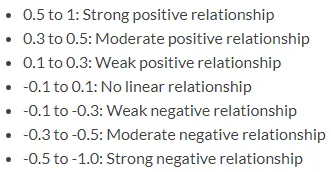
To protect your investments from heavy volatility, you want to have a healthy mix with cryptocurrencies that have some (strong) positive relationships, but definitely also some that have (strong) negative relationships. Therefore, one might argue that when you have Bitcoin and Ethereum, it might be a good idea to also have Ripple because of the relative low correlation.
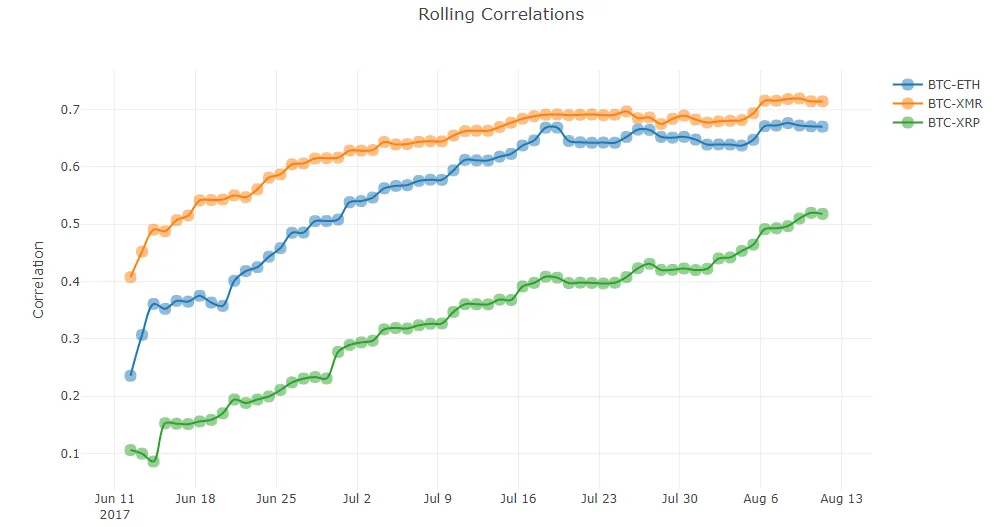
Definitely check out Sifrdata.com and play around with all the options. Make sure to check out the rolling correlation as well! It gives beautiful and insightful graphs like this:
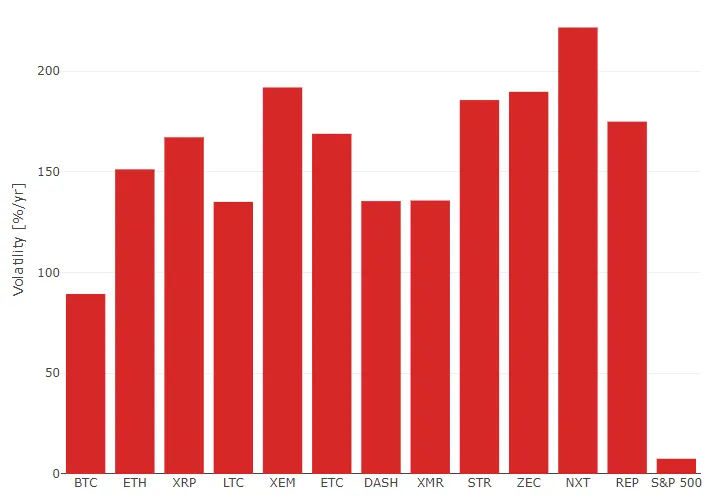
Or check out volatility of the cryptocurrencies (handy S&P 500 volatility included for comparison purposes):
Tell me, what other tools and websites do you use to analyse and optimize your portfolio? Leave a comment below :-)
---> 👍🏼 Follow me for regular updates on my cryptocurrency portfolio, my portfolio approach, crypto research or just some Dice Challenges to train your brain ;-)
---> 👍🏼 Resteems are appreciated!
Disclaimer: I am not a financial advisor, trader or developer. I am just a crypto/blockchain enthusiast. Please do your own research, draw your own conclusions and do not invest any money that you cannot afford to lose.