There are thousands of cryptocurrencies and projects in the market, making it really difficult to find the good ones. I have a hypothesis that price follows development. As long as the project is still being actively developed, the price should eventually keep up and be on par with its peers. So today, I am going to do a simple analysis. The objective is to identify a list of crypto projects that are very active in development but relatively low in market cap.
When this hypothesis was first formed in my mind, the key issue I had was where can I easily get information on development activities of each project. Fortunately, @coingecko provides what they call the "Developer Score" for each project and conveniently exposes the scores through their API. First, let's take a look at why and how they track the "Developer Score".
Why Track "Developer Score"?
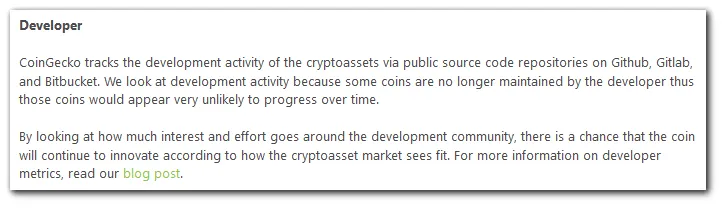
The reason for tracking development activities is simple. An inactive project is likely to be a dead project and vice versa. Having active developments also proves that the project likely still have funding and are still committed on their roadmap.
How is "Developer Score" tracked?
To understand how "Developer Score" is tracked, we have to read the blog post by @coingecko.
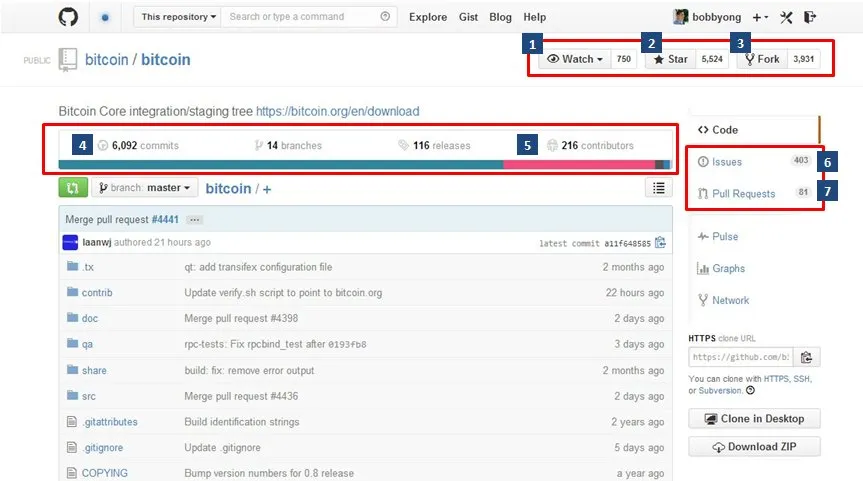
Essentially, @coingecko look at the projects' public source code repositories and based on 7 factors, they calculated the "Developer Score". The factors are,
- Number of people Watching
- Number of Stars
- Number of Forks
- Number of Commits
- Number of Contributors
- Number of Issues Tracked
- Number of Pull Requests
The blog post did not provide the actual formula on how the score is calculated, but I supposed they give different scoring weight for each metric and normalize it to provide a score between 0-100. At this point in time, only Bitcoin has a score of 100. So I am guessing they are using Bitcoin as the benchmark and the rest of the scores are somehow relative to it.
I do see a couple of limitations in using this approach. First, projects without known public repositories will not be given a score. Next, projects can potentially abuse the system by bumping up the numbers of those metrics without making real progress. I know that @coingecko is on Steem, so please correct me if I made any wrong assumptions.
In any case, short of scrutinizing the actual codes in those repositories, these metrics are perhaps the best available indicators to determine the development activities. With the approach and the limitations in mind, allow me to dive into the numbers.
Sorting out the Data
Of the 4145 listed coins on CoinGecko, 2474 coins have a developer score. Among the 2474 coins, there are quite a number that are without market cap data. I have decided to omit coins without developer score or market cap data from my analysis. (There are a few coins with decent developer score but no market cap data. I will perhaps take a look at these outliers in a later post)
1522 coins remain after filtering. In order to identify the coins with the most development activities, I used Excel to tabulate the 50th, 75th, 90th and 95th percentiles of developer score. Here is the result,
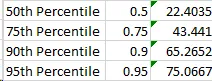
We can see that most projects do not have a high developer score. It goes to show that @coingecko formula of calculating developer score is probably quite stringent? Since the objective is to identify the rare gems, lets use the more stringent 95th percentile to continue the analysis.
The Top 5%
Let's now take a look at the top 5% of the coins in terms of developer activities,
| id | symbol | developer_score | market_cap |
|---|---|---|---|
| bitcoin | btc | 100.855 | $66,730,919,981.24 |
| ethereum | eth | 98.009 | $14,228,092,904.34 |
| eos | eos | 94.692 | $3,517,708,578.22 |
| monero | xmr | 90.955 | $803,156,247.02 |
| status | SNT | 90.725 | $70,977,519.96 |
| grin | grin | 90.356 | $13,420,351.68 |
| lisk | lsk | 89.83 | $158,207,706.43 |
| cardano | ada | 88.783 | $1,324,814,080.21 |
| stellar | xlm | 88.599 | $1,631,360,711.01 |
| nano | nano | 88.536 | $116,592,196.52 |
| raiden-network | rdn | 87.969 | $14,726,443.58 |
| zcash | zec | 87.521 | $310,738,574.04 |
| golem | gnt | 87.446 | $63,566,931.72 |
| rchain | rhoc | 87.418 | $9,776,990.17 |
| tron | trx | 87.29 | $1,572,830,846.68 |
| bitshares | bts | 86.803 | $123,879,170.00 |
| lbry-credits | lbc | 86.665 | $5,552,704.01 |
| skycoin | sky | 86.443 | $13,226,075.38 |
| turtlecoin | trtl | 86.162 | $3,468,922.73 |
| aeternity | ae | 85.842 | $97,019,055.28 |
| 0x | zrx | 85.706 | $142,465,804.34 |
| waves | waves | 85.613 | $265,621,039.00 |
| qtum | qtum | 85.311 | $167,063,661.07 |
| nimiq-2 | nim | 84.935 | $2,439,613.26 |
| nimiq | net | 84.935 | $490,888.62 |
| decred | dcr | 84.561 | $154,573,154.14 |
| peercoin | ppc | 84.48 | $12,343,892.95 |
| red | red | 84.46 | $790,917.98 |
| dash | dash | 84.365 | $700,167,534.09 |
| zilliqa | zil | 83.176 | $145,755,400.17 |
| aelf | elf | 83.047 | $55,211,643.51 |
| verge | xvg | 83.01 | $95,037,205.86 |
| pivx | pivx | 82.944 | $44,346,210.30 |
| iota | miota | 82.802 | $786,247,794.94 |
| ark | ark | 81.86 | $81,534,871.39 |
| blocknet | block | 81.789 | $16,020,491.30 |
| chainlink | link | 81.691 | $155,777,016.34 |
| melon | mln | 81.28 | $9,064,294.95 |
| bismuth | bis | 81.207 | $2,203,368.55 |
| dovu | dov | 81.004 | $628,227.21 |
| ripple | xrp | 80.871 | $12,942,022,442.77 |
| zcoin | xzc | 80.624 | $37,174,137.16 |
| kyber-network | knc | 80.066 | $24,962,800.58 |
| namecoin | nmc | 79.97 | $9,108,395.40 |
| gxchain | gxs | 79.967 | $38,145,559.27 |
| nebulas | nas | 79.964 | $27,485,063.59 |
| metaverse-etp | etp | 79.874 | $37,977,700.31 |
| tezos | xtz | 79.649 | $318,293,938.95 |
| nos | nos | 79.17 | $3,001,731.03 |
| dadi | dadi | 79.124 | $2,346,689.72 |
| nav-coin | nav | 79.046 | $10,025,953.71 |
| ontology | ont | 79.003 | $534,556,964.91 |
| holotoken | hot | 78.703 | $202,141,991.32 |
| neo | neo | 78.548 | $581,128,450.03 |
| gas | gas | 78.548 | $34,181,793.12 |
| vite | vite | 78.179 | $5,911,541.53 |
| particl | part | 78.026 | $20,142,248.18 |
| bitcoin-gold | btg | 77.808 | $222,775,096.44 |
| omni | omni | 77.774 | $1,334,676.09 |
| bancor | bnt | 77.665 | $32,932,288.79 |
| basic-attention-token | bat | 77.519 | $195,354,344.30 |
| stakenet | xsn | 77.163 | $7,263,325.03 |
| storj | storj | 77.022 | $31,657,358.57 |
| ergo | efyt | 76.67 | $835,273.06 |
| byteball | gbyte | 76.506 | $25,776,308.52 |
| litecoin | ltc | 76.349 | $2,702,496,803.94 |
| asch | xas | 76.207 | $8,039,883.49 |
| bytom | btm | 76.138 | $129,439,522.76 |
| daostack | gen | 75.871 | $4,944,713.48 |
| wownero | wow | 75.866 | $160,122.09 |
| iostoken | iost | 75.668 | $97,460,837.36 |
| dagger | xdag | 75.564 | $1,329,001.28 |
| sonm | snm | 75.526 | $7,849,746.74 |
| boscoin-2 | bos | 75.228 | $11,394,173.99 |
| siacoin | sc | 75.206 | $94,172,084.53 |
| icon | icx | 75.145 | $128,821,408.22 |
| fundrequest | fnd | 75.058 | $159,398.17 |
Among this list, the average market cap is $1.45 billion. But that is likely being skewed by the top cryptocurrencies such as Bitcoin, Ethereum and EOS. So the median market cap of $38 million might be a better choice to see which projects are undervalued despite being among projects with highest developer activity.
With that in mind, assuming the projects will eventually catch up with the median market cap of $38 million, I calculated the potential return multiples for each of these project. Here is the list of 37 projects that have a market cap of under $38 million.
| id | symbol | developer_score | market_cap | potential_return_multiples |
|---|---|---|---|---|
| wownero | wow | 75.866 | $160,122.09 | 237.32 |
| fundrequest | fnd | 75.058 | $159,398.17 | 238.40 |
| dovu | dov | 81.004 | $628,227.21 | 60.49 |
| red | red | 84.46 | $790,917.98 | 48.05 |
| ergo | efyt | 76.67 | $835,273.06 | 45.49 |
| omni | omni | 77.774 | $1,334,676.09 | 28.47 |
| dagger | xdag | 75.564 | $1,329,001.28 | 28.59 |
| bismuth | bis | 81.207 | $2,203,368.55 | 17.25 |
| nimiq-2 | nim | 84.935 | $2,439,613.26 | 15.58 |
| dadi | dadi | 79.124 | $2,346,689.72 | 16.19 |
| nos | nos | 79.17 | $3,001,731.03 | 12.66 |
| turtlecoin | trtl | 86.162 | $3,468,922.73 | 10.95 |
| lbry-credits | lbc | 86.665 | $5,552,704.01 | 6.84 |
| daostack | gen | 75.871 | $4,944,713.48 | 7.68 |
| vite | vite | 78.179 | $5,911,541.53 | 6.43 |
| stakenet | xsn | 77.163 | $7,263,325.03 | 5.23 |
| sonm | snm | 75.526 | $7,849,746.74 | 4.84 |
| asch | xas | 76.207 | $8,039,883.49 | 4.73 |
| melon | mln | 81.28 | $9,064,294.95 | 4.19 |
| rchain | rhoc | 87.418 | $9,776,990.17 | 3.89 |
| namecoin | nmc | 79.97 | $9,108,395.40 | 4.17 |
| nav-coin | nav | 79.046 | $10,025,953.71 | 3.79 |
| peercoin | ppc | 84.48 | $12,343,892.95 | 3.08 |
| grin | grin | 90.356 | $13,420,351.68 | 2.83 |
| boscoin-2 | bos | 75.228 | $11,394,173.99 | 3.34 |
| skycoin | sky | 86.443 | $13,226,075.38 | 2.87 |
| raiden-network | rdn | 87.969 | $14,726,443.58 | 2.58 |
| blocknet | block | 81.789 | $16,020,491.30 | 2.37 |
| particl | part | 78.026 | $20,142,248.18 | 1.89 |
| kyber-network | knc | 80.066 | $24,962,800.58 | 1.52 |
| byteball | gbyte | 76.506 | $25,776,308.52 | 1.47 |
| nebulas | nas | 79.964 | $27,485,063.59 | 1.38 |
| storj | storj | 77.022 | $31,657,358.57 | 1.20 |
| bancor | bnt | 77.665 | $32,932,288.79 | 1.15 |
| gas | gas | 78.548 | $34,181,793.12 | 1.11 |
| zcoin | xzc | 80.624 | $37,174,137.16 | 1.02 |
| metaverse-etp | etp | 79.874 | $37,977,700.31 | 1.00 |
Are these the hidden gems in crypto space right now? We cannot be sure, there is still a need to understand what each of these projects are about. However, at the very least, given such developer activities, these small caps are probably safer bets than any other projects with similar market cap. I also created a portfolio of these coins with dummy investments of $100 each to track the performance (with the exception of XDAG, which I cannot track it on Blockfolio).
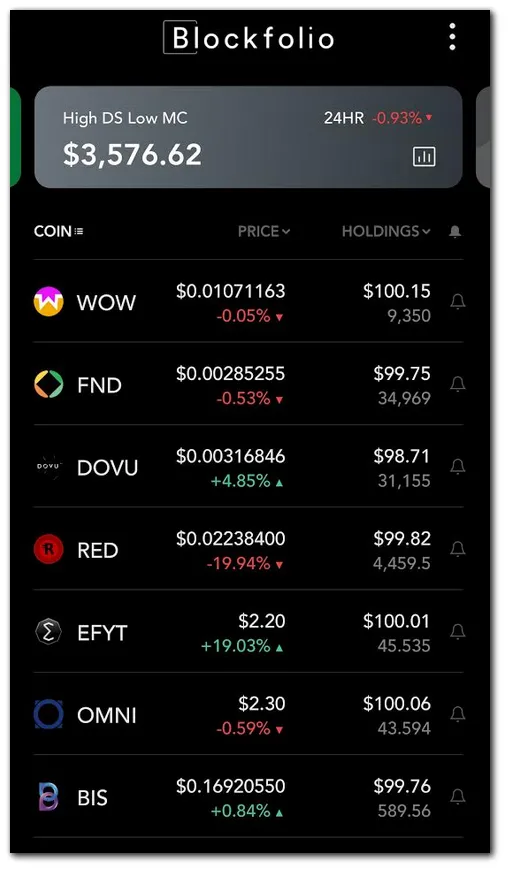
Seems like it is off to a poor start as I lose $24 while I was inputting the dummy transactions 😂. Anyway, I will keep track of this portfolio and perhaps provide some quick updates in the future. Thanks for reading and please share your thoughts!