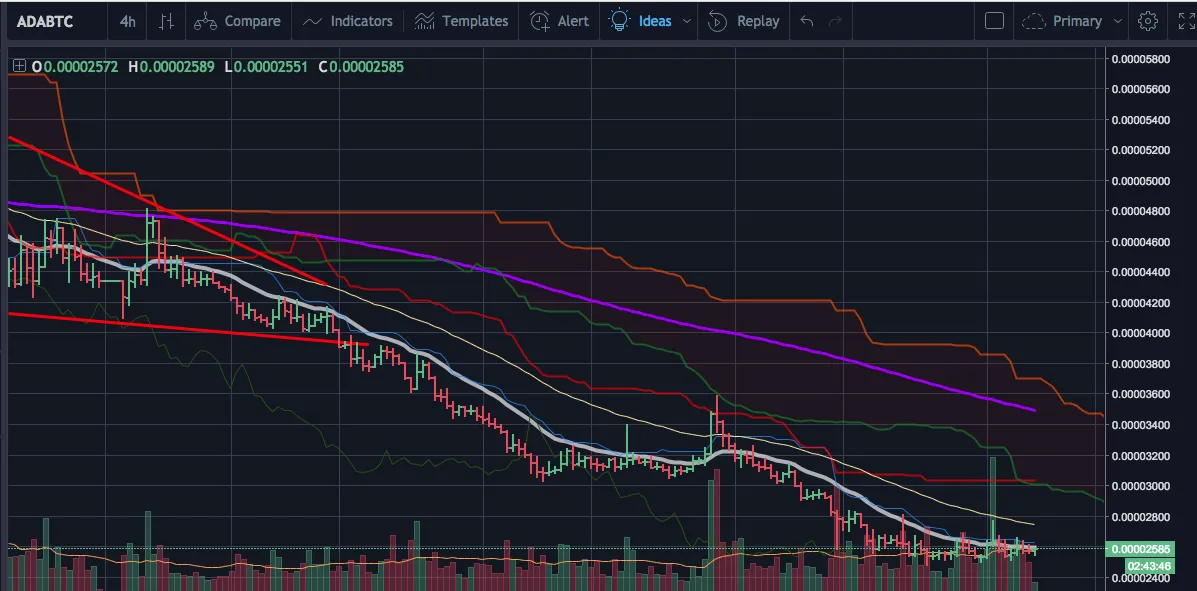
Looking at ADA's chart for the first time in a couple of weeks, there are some things I like about what I'm seeing presently. It appears to have found some support and has been trading sideways on the floor for a bit.
I see a bit of an uptick in volume with one huge breakout spike in the mix (probably from a pump and dump event). Zooming in a bit closer on a 2 hour chart, I'm seeing a few spinning tops indicative of a fairly stable price point at the moment. I will be watching this one in the short term rather closely for potential short to mid-term trade to the upside.
I'd like to see the price action climb above the EMA 50 (gold line) and close a couple of candles above before entering the fray.