I believe that if you invest $1,000 in the right coins today it could make you a millionaire within the next 5 years but how do you pick the coin? What is it that decides the eventual price?
I’ll be exploring that in this series by looking at the different elements that impact on a coin’s price. I’ve chosen to start today by looking at circulating supply.
What is circulating supply?
When looking at the supply of a coin there are three numbers you will normally be faced with, these (as defined by Coinmarketcap) are:
- Circulating Supply is the best approximation of the number of coins that are circulating in the market and in the general public's hands.
- Total Supply is the total amount of coins in existence right now (minus any coins that have been verifiably burned).
- Max Supply is the best approximation of the maximum amount of coins that will ever exist in the lifetime of the cryptocurrency.
I have picked circulating supply because it is an estimate of the number currently in circulation.
Why should circulating supply matter?
The value of cryptocurrency at any one point in time is completely governed by supply and demand - the value of a coin is the meeting point between what people are willing to sell it for and what people are willing to pay for it.
Circulating supply is the number of coins available at any one moment, i.e. it is the ‘supply’ in supply and demand so intuitively the lower the circulating supply is the higher the price should be.
As a simple example, if you have 4 lambos and 100 people trying to buy them you will get a much better price ‘per lambo’ than you would selling 120 lambos to the same 100 people.
Does circulating supply matter in cryptocurrency?
So we have established there should be a relationship; a higher circulating supply should mean a lower price.
Is this true for crypto? Let’s take a look at the top 100 coins as of today to find out:
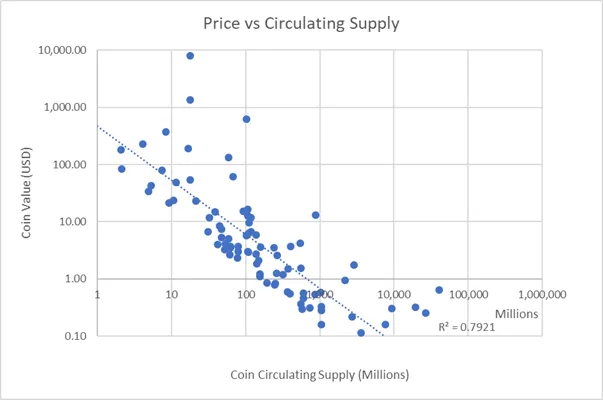
Note that to get a sensible graph I have had to use log scales otherwise the value of BTC and the circulation of Ripple would make most of the coins illegible.
As it turns out logarithmic is probably the way to view crypto as the graph pretty much shows what we were expecting to see – the value of coins tends to fall as we increase the circulating supply. The R^2 value (a statistical measure which shows how closely data is fitted to the dotted regression line) is 0.7921. If this figure was 1.0000 then it would mean the price of a cryptocurrency is completed defined by its circulating supply, if it was 0.0000 then it would mean the circulating supply has no impact on coin value.
The relationship here is strong but there are outliers. Let’s have a closer look at a few of the points on this chart:
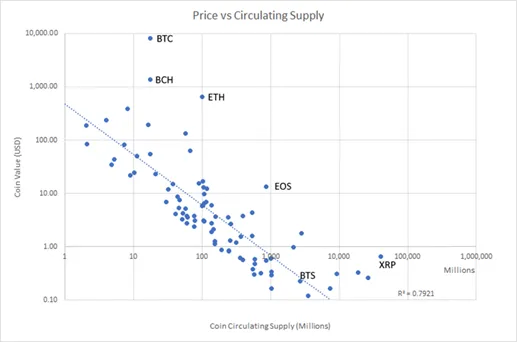
The biggest outlier is BTC. Does this mean its due for a massive correction to bring it down to the trendline?
In my view no. I think that what this chart is showing us is that generally a coin’s value is linked to its circulating supply but that when mass adoption/interest occurs the potential for breakout is huge (bear in mind we are on logarithmic scales here so a little upwards movement can be a massive increase in price!).
We can look at a few specific altcoins that have ‘broken free’ of this trendline:
- Bitcoin Cash has succeeded in securing interest and adoption as a faster alternative to BTC.
- Ether has made itself a standard for token launches.
- Ripple is a classic one where arguably the interest and adoption they have managed to achieve has led to a price which is disproportionate to both the technology and the available supply.
- EOS is a potentially game changing technology currently generating more excitement and FUD than any pre-launch coin I can think of for a long time and you can see that has allowed it to break free from the trend line.
Interestingly the chart does not show any coins in the top 100 as hugely undervalued and I think the big lesson here is that there needs to be ‘step change’ in adoption / interest for a coin to really break upwards.
To try and look at that a little closer I chose a coin I believe is massively undervalued and marked it on here – Bitshares (BTS). This is (in my view) a coin that should be at a minimum of $3-4 because of its insanely fast transaction speeds, low fees and smart coins but is currently sat at $0.23.
Despite what seems to me a complete undervaluing it turns out it is one of the coins that sits most closely to the trendline. I think this just underlines the importance of adoption and interest to the success of a coin. Maybe a weakness of decentralisation and not having a central marketing team pushing the coin forward.
I’ll be looking at the ‘demand’ side of supply and demand in my next post.
Comment and thoughts welcomed below.
This is my first Steemit post so hopefully its been of interest - let me know if you have any suggested additions or if you want your altcoin marked on the chart so you know where it sits :)