I've done more simulation and now you can see the results more visually in 3D :)
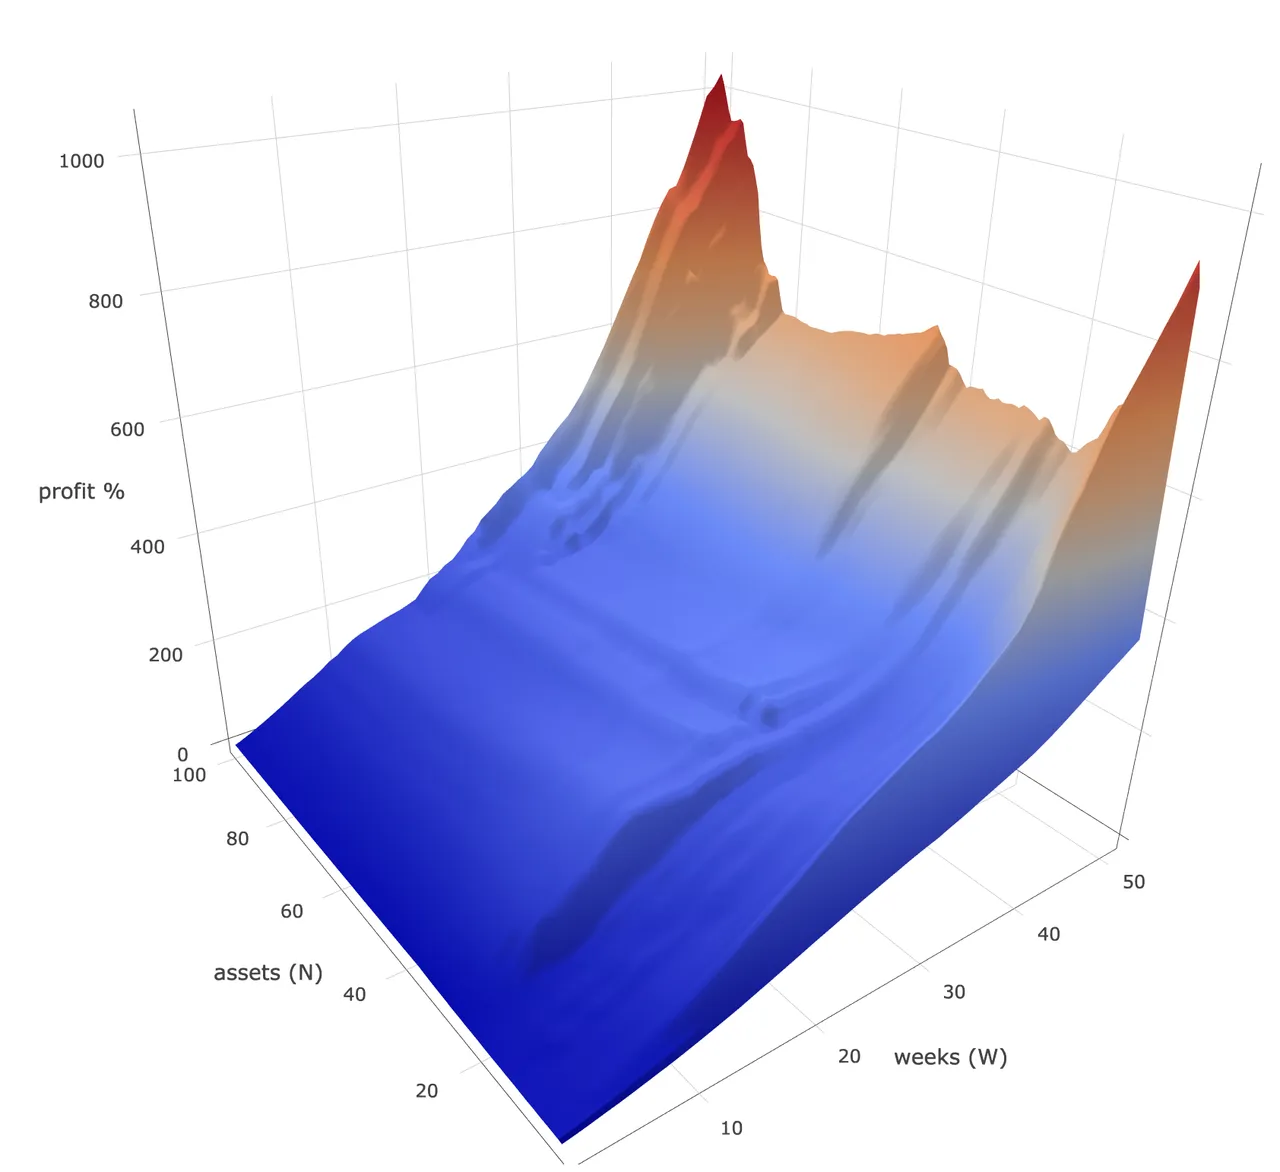
It's profit simulation for investing in top N crypto assets equally for W weeks using coinmarketcap.com's historical data. Please read the previous post to see how it is simulated.
You can rotate, zoom to see the graph interactively from https://mix1009.com/crypto/simulation.
The simulation was done for all points for N(number of top assets invested)=1..100 and W(weeks invested)=1..52.